Bitcoin Analysis Highlights
Bitcoin price is on a rally since bouncing off the lower descending trend line.
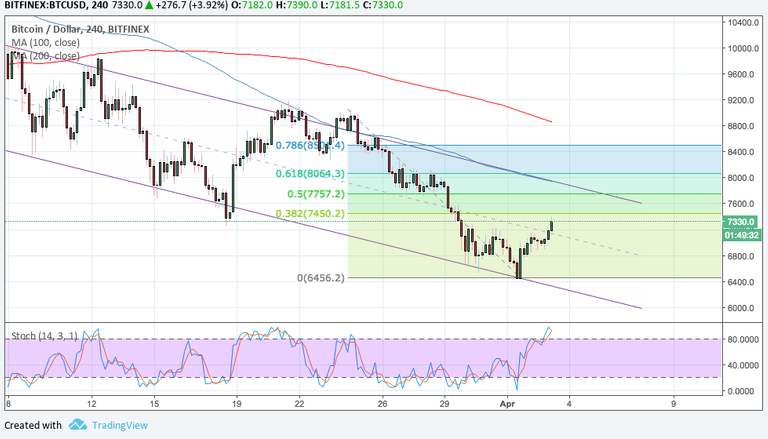
The rally may be be part of a bearish correction to the Fibonacci levels on a 4 hour chart.
Bitcoin price is trading inside a downward trending channel and is heading quickly to the correction area.
Bitcoin price is going up but is showing signs of a correction on longer term charts.
Bitcoin Price Chart

Chart Analysis
The 100 SMA is below the longer term 200 SMA, this may confirm Bitcoin price could soon head down.
The 38.2% Fibonacci level is $7450.2. The 50% Fib is at $7750, a former support but now a resistance. The 61.8% level is near the top of the downward trending channel at the $8064.3 level and the 100 SMA line, this may be the top of this rally.
If Bitcoin price does not pass the resistance levels price could drop to the swing low of $6450.
Market Factors
Some analysts suggest that an increase in the overall market is a key factor that may have made Bitcoin rally. During the last 12 hours trading volume has gone up in popular exchanges such as Bitfinex and Binance.
Some analysts also predict that if the price holds above $7000 it may soon test $8000 or higher.
New to crypto? Join Coinbase with my link to get $10 of free bitcoin when you buy or sell $100 worth of Bitcoin.

Legal Disclaimer:
I am not a financial adviser nor is any content in this article presented as financial advice. The information provided in this blog post and any other posts that I make and any accompanying material is for informational purposes only. It should not be considered financial or investment advice of any kind. One should consult with a financial or investment professional to determine what may be best for your individual needs.


Interesting analysis. it seems to seem 6000 soon.
It could after this rally