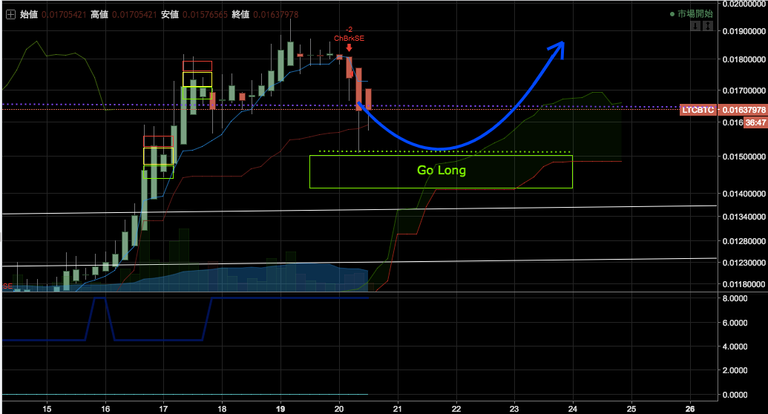
Litecoin/Bitcoin Chart:
https://jp.tradingview.com/x/m2jm9aV3/
TL;DR Go long under 0.0165
Analysis:
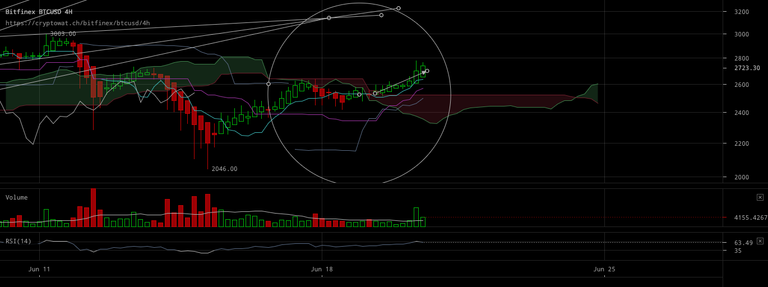
Looks like we're coming down off of a nice run, if you're an aggressive scalper I suppose you could risk opening a short at/near 0.0165 I think the next 6 candles will make a bit of a 'U' shape as Litecoin in the past has wanted to re-test and test again these long-term dotted lines "just to be sure" before going for higher highs. Looking at the Bitcoin USD chart, the price is headed up after completing an inverse head and shoulders, we could possibly see a throwback before seeing higher highs - supporting my $LTCBTC analysis.
Bitcoin/USD Chart:

Thank you for providing this detailed analysis. It is quite important to keep track of the crypto that you are interested in in such a way. Maybe i will open a position on LTC someday :). Have fun out there and good luck with your future posts!
Thanks @rymlen! I appreciate your gratitude very much :) Good luck on your future $LTCBTC/$LTCUSD/$LTCXMR trades!