Bitcoin is above U.Today’s mentioned resistances
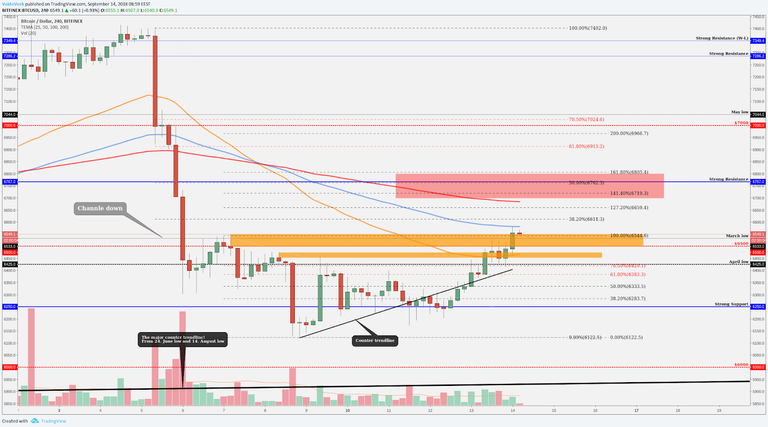
Yesterday, we said that Bitcoin shows some bullish volume and it shows some strength to go upwards. Currently, the last four-hour candle close was exactly above our last marked resistance area at $6,550 which means that we have a breakout from the strong resistances and now, starts to play our next previously mentioned resistance level at $6,700-$6,800. In this level zone, the price could turn around and be bearish again.

It is technically a good short opportunity because technically, our bias is bearish based from the previous week candle close which was bearish "Engulfing.”
$6,700-$6,800 area short criterias are:
The Fibonacci retracement 50 percent (pulled from Sept. 5 to Sept. 8)
The Fibonacci extension 141 percent to 161 percent (pulled from Sept. 7 to Sept. 8)
Strong resistance area $6,787-$6,800
200 EMA starts to work as a resistance
We also might see a throwback from the bigger Fibonacci 38 percent level around $6,600 On the four-hour chart, we meet with the 100 EMA line. 38 percent is also important because if the pressure is down (currently the long-term pressure is down) then from this level we could see a bigger throwback but let’s see!
Currently, the last candle close and the price structure shows us positive signs and our main aim is still $6,700-$6,800 if we climb higher, there we want to search some bearish price action (candlestick patterns, chart patterns on the lower timeframes, minimum 15 min, volume) before we start doing anything.
Ethereum (ETH/USD) one of the top gainers in the trendline party

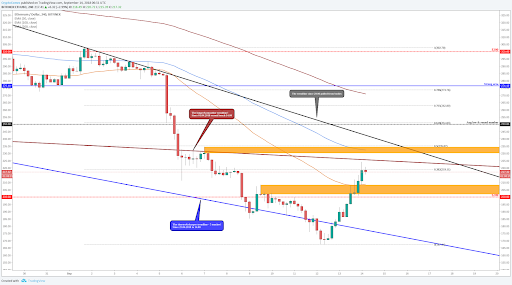
Ethereum has made a 33 percent increase since Sept. 12, it bounced upwards from $170 and now the current price is around $215. The bounce came from the sharper trendline area. After the bounce, we got from the daily timeframe a nice bullish candlestick pattern called "Morning Star" and this momentum gave a boost to break back above the blue trendline, above the $200, above the orange resistance level, above the 50 EMA (on the one- hour timeframe it trades above all the EMA's - 50, 100, 200).
Ethereum (ETH/USD)
Currently, the price sitting on the Fibonacci retracement level 38 percent and it approaching the trendline (dark red) which is pulled from April 1, 2018 and could start to work as a resistance. Above the current price are heavy resistances after another:
The longer and smoother trendline since April 1, 2018- $225
Previously worked resistance- $230-$234.5
Fibonacci retracement 50 percent- $235
The trendline since July 29 - $237-$241
If we can beat those levels then the Ethereum panic selling could be over.
Take a look at Cardano (ADA) Price Analysis, Sept. 14, 2018
Have a nice day!
@cryptorumblefish, I gave you a vote!
If you follow me, I will also follow you in return!
Enjoy some !popcorn courtesy of @nextgencrypto!
Done @nextgencrypto
Warning! This user is on my black list, likely as a known plagiarist, spammer or ID thief. Please be cautious with this post!
If you believe this is an error, please chat with us in the #cheetah-appeals channel in our discord.