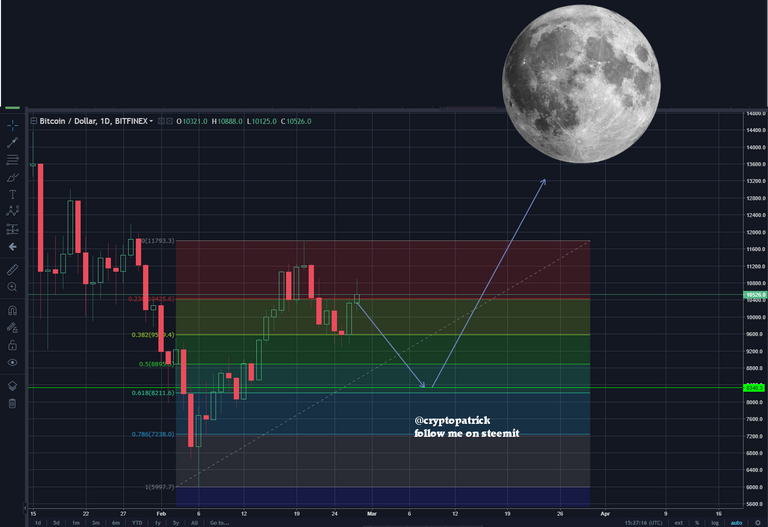
Keep in mind, I'm still a noob when it comes to chart reading and price retracements. What I do know after studying charts is the first wave often retraces more than the .382. Plus, if it came down, it will make more of an "ABC" correction, using the fib extension tool from the .382 low and the high of the current 24 hour candle for a 1 to 1 extension at the $8,340 range. Which is in the "golded pocket" range of the .618.
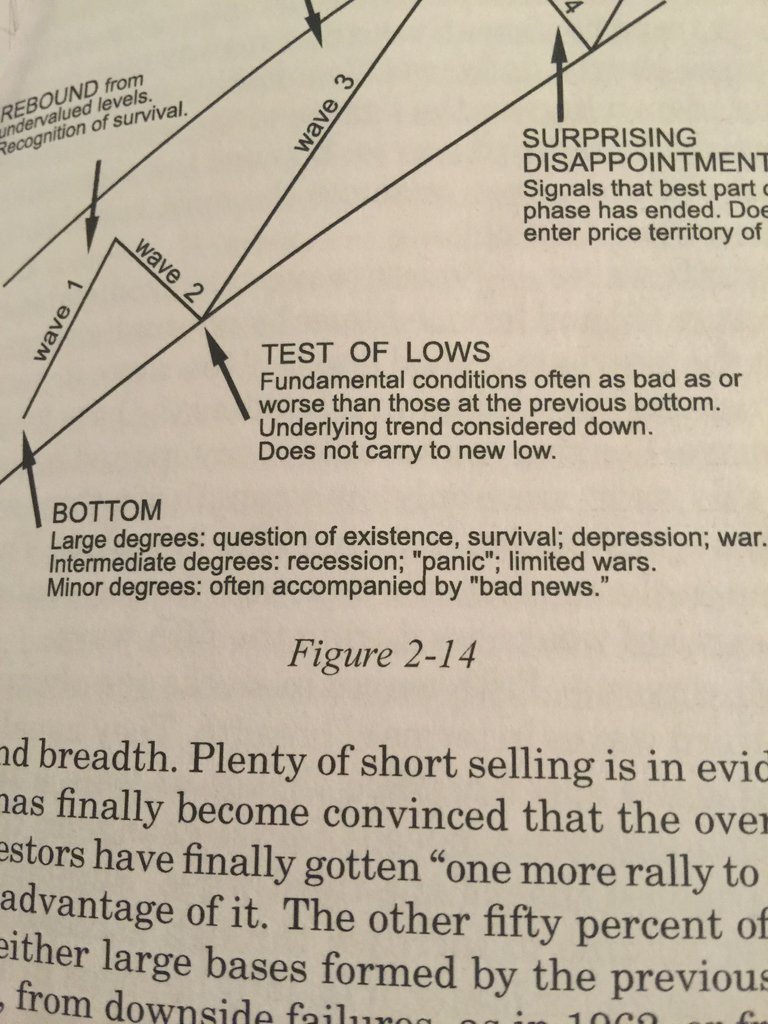
All of this is nullified if we break 10,900 of this 24 hour candle. Which I have know idea how much time is left on it, since my counter on trading view doesn't work. I also know that the first wave doesn't have to retrace to any certain amount. The reason it usually does is due to the fact it's the first one in the opposite of the previous trend. As seen in this second picture, as wave 2.
Anyone with chart reading experience is welcome to comment on how I got this wrong or right. Thanks! Oh and this is not finical advise of course, like I said I'm still a noob. Also I realize that we will not go directly to the moon, but the third wave is usually the largest.
