OKCoin Exchange Chart
Sep 09-02-2017
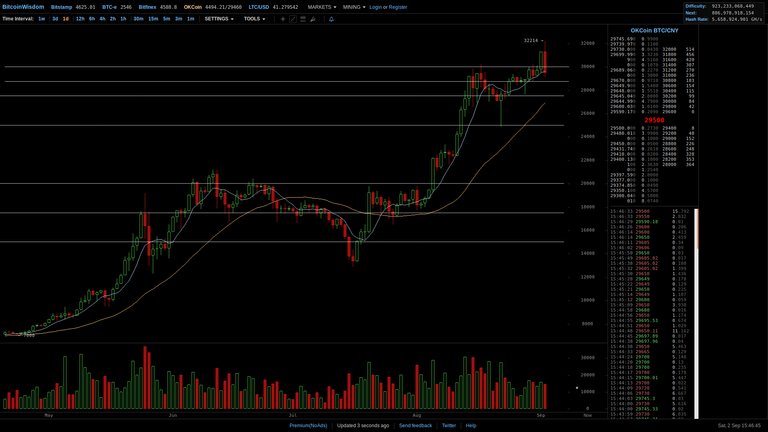
Price 29500
1d Timeframe
Pull Back to 30000
Or Bull Trap ?
Horizontal Lines
30000 Support or Resistance ?
28750
27500
25000
20000
17500
15000

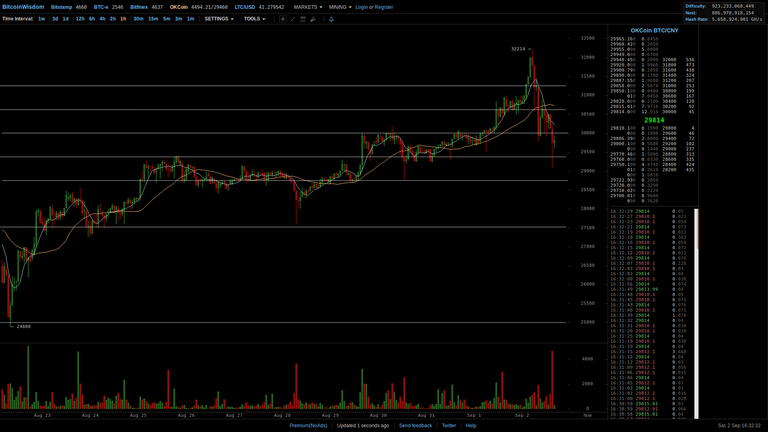
1h Timeframe
Chart Pattern
Head & Shoulder
Horizontal Lines
31250
30625
30000 Noticeable Bear Volume Spike Breakthrough
29375
28750
27500

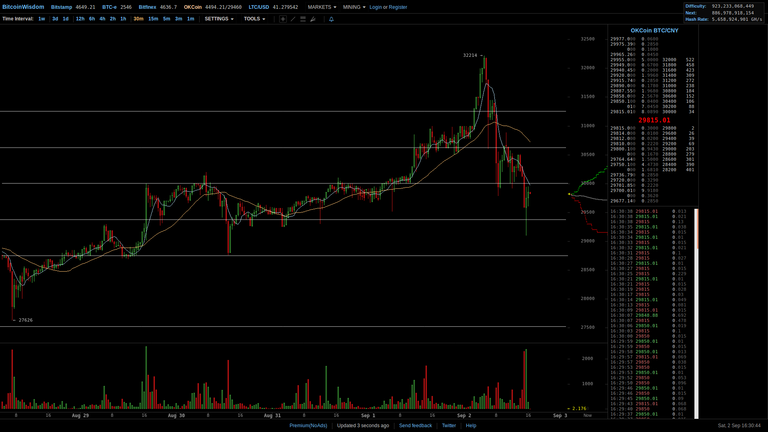
30m Timeframe
Chart Pattern
Head & Shoulder
Horizontal Lines
31250
30625
30000 Pull Back
29375
28750
27500

Under 30000 Bear Area
