CryptoKraze Technical Analysis

Possibility on 4 Hour Chart

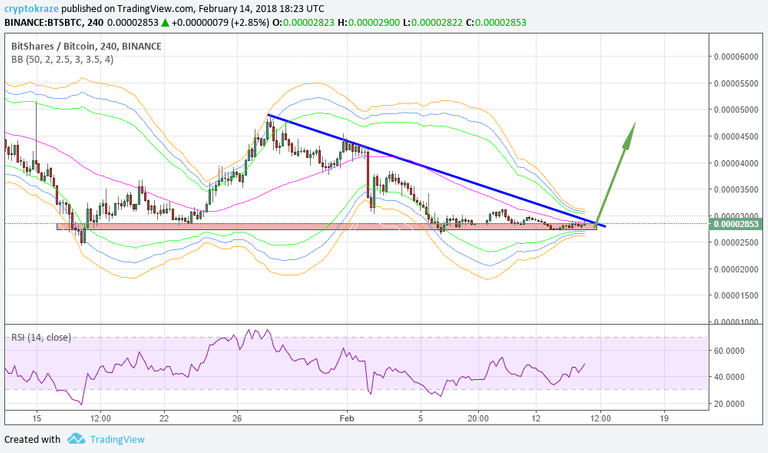
If you look at 4 hour chart, you will see Bitshares has formed a symmetrical triangle and likely to breakout. This is very common pattern in cryptocurrencies, whenever a coin makes this descending triangle, a breakout is imminent that might happen anytime soon. If we look at RSI, it has touched 70 level and has dipped below 50 level. It has to rise up to touch 70 level again.
- I have a buy entry at 0.00002800 and my profit target will be around 0.00004700 or above.
- Stop loss just below the entry area is must for trading if you don't know the Averaging Technique in Crypto Trading.
Crypto Trading is risky business and you can loss partial or full amount of money. Trade at your own risk with that money only you can afford to lose. Bitcoin unexpected move will make this analysis void.


Follow ADSactly at Discord

Price is putting more pressure to the downside than upside. So, a break to the upside is very possible too.
If bitcoin can break 10000 then volume will come to market and bitshares will also break above.
I am having ALOT of trouble deciding what to do right now too! Last nights breakout was AMAZING, but will it continue? Or will we experience a short term correction today / tmrow? Everything is so dependant on what happens right now and tmrow. If we go down we go down alot, if we go up we go up alot. Wish I could watch the charts all day =)
Thank for your informations,
I like it
Nice , thaks you in information
https://steemit.com/gaming/@darmian23/special-10-recommendation-of-this-weekendroid-games-0204d2cbc13a7
Thank you for the article. if all is so, then consider Bitshares
I made a nice profit on LTC yesterday, looking to invest that money into something new. You are amazing for presenting bitshares like this, GREATLY appreciate the TA.
May I ask what your portfolio is @cryptokraze looking like right now? I'm still trying to keep an eye on ENG XLM NEO LTC ETH. Now I will look into bitshares!
Best of luck for your targeted profit 0.00004700 or above. 👍👍👍