CryptoKraze here

Possibility on 30 Minutes Chart

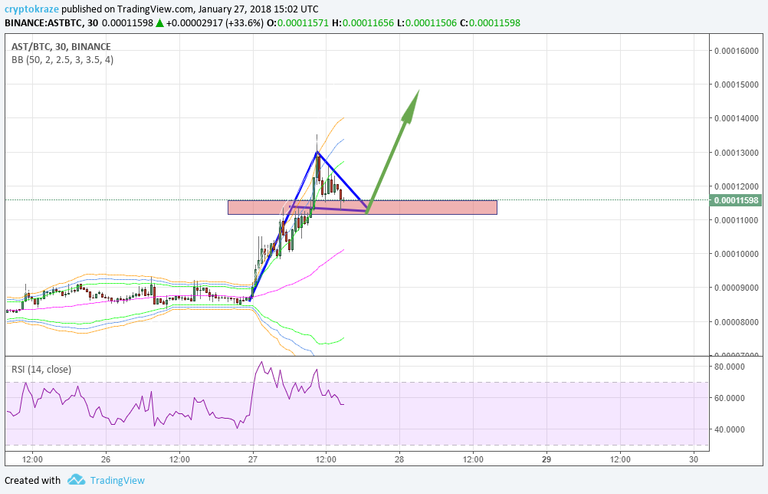
If you look at 30 minutes chart, you will see $AST has made a big impulsive move and now it is forming bullish flag. This is very common pattern in cryptocurrencies, whenever a coin breaks with big impulsive move, it pulls back and waits for some time before making next impulsive move. If we look at RSI, it has gone above 70 level in first impulsive move and has to dip close to 50 level now, so we have a pull back done and next impulsive move is ready. If we look at bollinger bands, the price has touched upper bands and now it will reach median line and then break above.
- I will have a buy entry at 0.00011200 with my profit target will be around 0.00014800 or above.
- Stop loss just below the entry area is must for trading if you don't know the Averaging Technique in Crypto Trading.
Crypto Trading is risky business and you can loss partial or full amount of money. Trade at your own risk with that money only you can afford to lose. Bitcoin unexpected move will make this analysis void.


Follow ADSactly at Discord

good info
Great article.
Would like to help my articles to shine which are meant to educate our community and to push their awareness. Many thanks : https://steemit.com/cyptocurrency/@stylesteemer/h9j1t-cryptohack-usd723-hacked-coincheck-the-nice-the-bad-and-the-future#comments
I agree with your analysis, so many of these altcoins will have a major bull flag after a breakout before running again. Especially if BTC starts running again it will further reinforce the pattern. Its a great pattern to spot other than tracking just dip buys at support and breakouts.