A. Overview February 2018
Technical Analysis Review on Feb 2018
BTC has passed deep correction on Feb 2018, as the lowest price reached to $6,000. In the first week, sellers were dominating the market which leads to the bearish sentiment. This action has successfully drowning BTC into $6,000 from $10,221 as the open price on 1 Feb 2018. Later on, the price slightly moved upward as the buyers taking long position, then finally it brought the price stood on the peak of Feb 2018 which is approximately $11,788. However, the market participant was still indecision as the market suffered a minor correction after prior bullish sentiment, which leads the price dropping into $10,315 (closing price in Feb 2018).
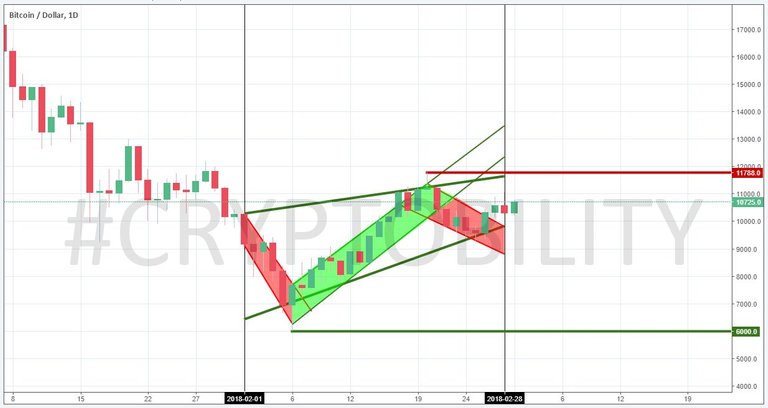
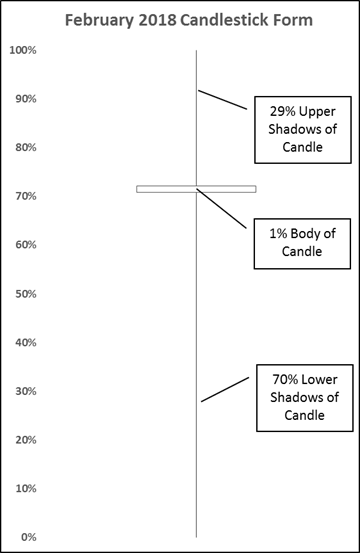
If we take a look at the daily chart timeframe, we could see that the candles were following the MA30 downtrend, until it retraced from $6,000 of its support and then crossed the MA 30. Also, we could see from Feb 2018 candlestick form that it is classified as “long shadows doji”. It is indicating that sellers dominated during the session and drove prices lower. However, the buyers later resurfaced to bid prices higher by the end of the session and the strong close created a long lower shadow. The body of candle is really small which is counted at only 1% from its total range. Meanwhile, the long lower shadow and upper shadow are counted at 70% and 29% respectively. This indicates the posterior market movement would have possibility to change/interrupt the current major trend (bearish) or also known as reversal of the current major trend.
Forecast vs Actual on Feb 2018
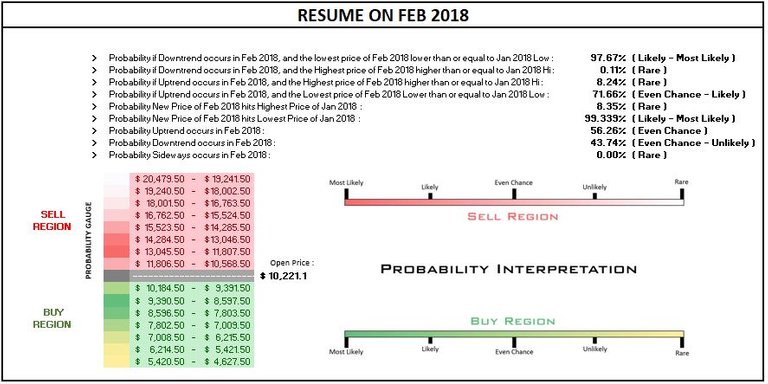
According to the previous simulation on Feb 2018, the result told us that the probability of uptrend in Feb is amounted to 56.15%. It means that the uptrend is even chance to be occurred. While, the downtrend is amounted to 43.85% and it is even chance - unlikely to be occurred. Then, the probability the price would reach Highest of Jan 2018 is amounted to 8.35% which means it is classified as rare event to be occurred in Feb 2018. Conversely, the lowest price of Feb 2018 would reach to Jan 2018 lowest is considered as likely - most likely to be occurred in Feb 2018 due to the probability value is amounted to 99.399% (higher than 8.35%).
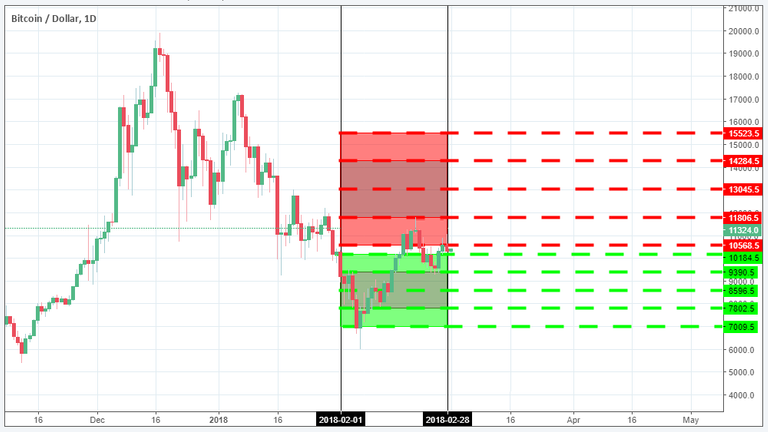
Furthermore, according to the previous simulation, we notice that there are several price levels which possible to be reached in Feb 2018. I have drawn the levels on the below chart, in order to provide us a better visualization as well as the convenience in comparing with actual data.
B. Input Parameters for Simulation
In this section, I would like to describe the modified parameters that I would use later on as input data for simulation. There are two parameters which should be updated before running the simulation for March 2018 : Distribution of Historical Daily Market Cap Growth and Decay (in percentage) and the forecasted total supply of BTC from 1 March – 31 March 2018. The following sub sections would describe the parameters respectively.
Normally Distributed Historical Daily Market Cap Growth and Decay
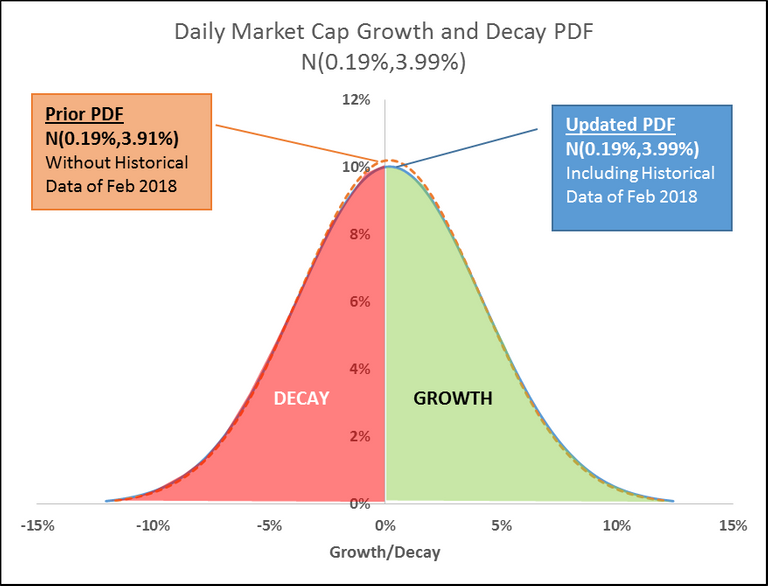
According to the “law of large numbers”, if the number of sample increases, the actual mean would converge on the theoretical mean. Based on this principle, it is better to collect more samples for building a proper simulation. Thus, I decide to collect historical data of February 2018 exactly from 1 Feb – 28 Feb 2018 and recalculate the Probability Density Function (PDF). The prior PDF shows that the mean of population is amounted approximately 0.19%, while the standard deviation is approximately 3.91%. As the latest samples gathered and joined into the prior population, the mean of the updated PDF is similar with the prior one, however the standard deviation is increasing into 3.99%. This indicates our sample variance are getting more vary than the prior one.
Forecasted BTC Total Supply from 1 March – 31 March 2018
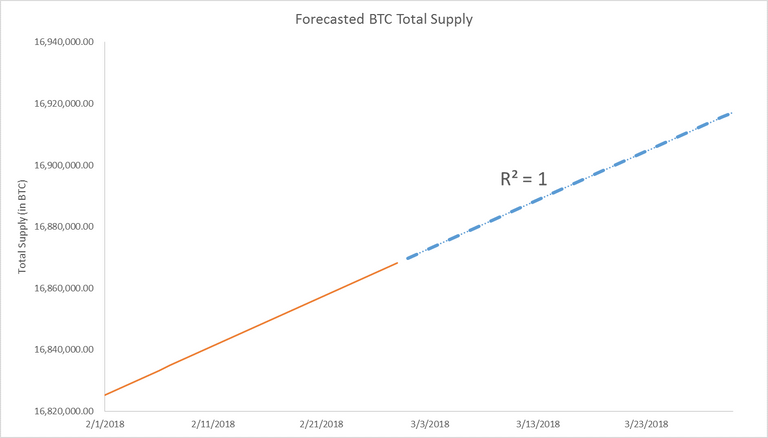
The other input parameter is forecasted total supply of BTC. Total supply of BTC would be assumed as linear time series function. The growth factor of its supply would be assumed as non-linear time series function, in this model I would utilize the lower incomplete gamma function for the growth factor.
C. Running the Simulation
Similar to my previous post, the numbers of simulation would consist of 40,000 steps of iteration due to convergence matter. Next, after the simulation has finished its calculation, we could extract all possible useful information as a benchmark of our decision for enter and exit the market. However, I usually use the result of calculation as a valuation of BTC price, whether the price is discounted or premium. I am not a short-term trader, I am more likely as a long-term investor, so I just buy the BTC every month of its possible low price and just HODL it in a longer timeframe. I also utilize averaging down method, because I am such a BTC believer. Below, I have attached a video of running simulation for March 2018.
D. Simulation Result
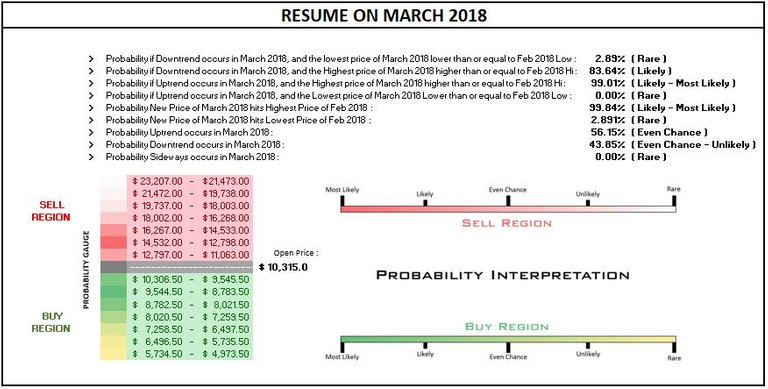
This section would summarize the result of 40,000 steps of iteration in simulation. The bottom line of the calculation has been summarized in the following table. The colorized bars in the table may give us some useful information for making decision to enter and exit the market. One thing to be noted, the colorized bars indicate how possible the price of March 2018 would mooning or drowning into certain range. Thus the colorized bars should be matched with the probability interpretation meter which I have also attached in the intended table.
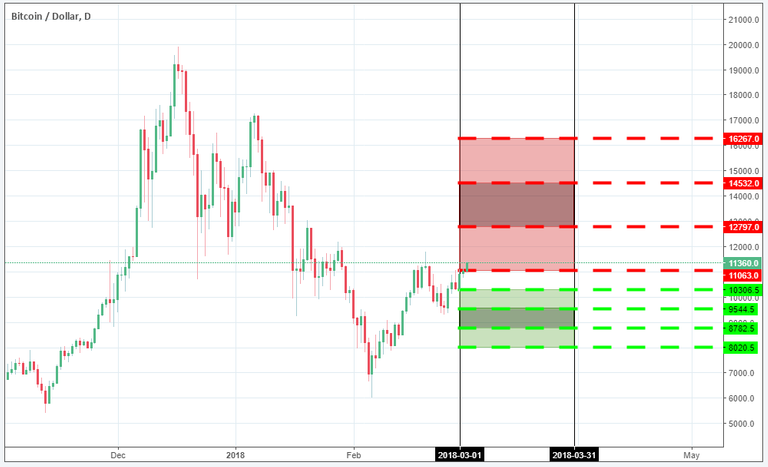
I have drawn in a chart that consist of possible range including some price levels which should be taken into account. The ranges as well as the price levels are based on the result of simulation.
Enclosure
I am not a financial or trading advisor, I am just an ordinary engineer who have interest in cryptocurrency. By posting this result to steemit, I just want to share what I have done in my leisure time. I do not enforce you to trade or investing in my way. Every people has their decision and unique trading way. Thank you for reading my post. Enjoy your crypto!
- BTC : 1KZQipWvGBL6PijbeE1QEGMDpe18U9zJkY
- ETH : 0x9f7d072e407d2f79ea165a02b38c8d05d1fcd3d2
