The last week has seen a clear breakout, with bitcoin subsequently pushing through a key resistance level. Alts are starting to look rather tasty, too.
Last week we noted that bitcoin had broken out of its downward-sloping channel, putting an end to immediate fears of retesting the $6,000 low (see https://medium.com/@CryptoInferno/inferno-market-update-a0d490fbc522). Having passed that sloping resistance line, a little over $8,000 at the time, the next zone of interest was $9,000. This has been a key support level in the past, with bitcoin pausing there on the way down from its December high, and a key resistance level on the way up, bouncing off it to go lower in mid-March. Just a glance at a chart shows BTC bouncing off this area – in both directions – several times in the past. Rising to $9,300 (at the time of writing) we expect this level now to become support once again.
After a three-month downtrend and several weeks of uncertainty, we are now looking at a trend change and, we believe, the beginning of the next bull market. Many indicators are flipping to neutral or bullish. One of the critical levels to watch will be $10,000.
The main reason for this is not technical but psychological. As a large, round number, $10,000 has always been a huge milestone for bitcoin. Since the bubble burst in January and after a slew of negative headlines, bitcoin has all but dropped out of the mainstream news. With the return of $10,000 we can also expect a return of media and public interest as new traders are forced to re-evaluate their assumptions.
Where it ends this time is very difficult to say. We’re still in the very early stages and you should expect setbacks as well as spikes in price. The best bull markets keep everyone guessing, with regular dips and ‘breathers’. Once the change in trend sinks in, that $20,000 peak is an obvious target and one that will take some breaking. If it does, we won’t try to call the top because bitcoin continually surprises. But just remember that humans like round numbers.
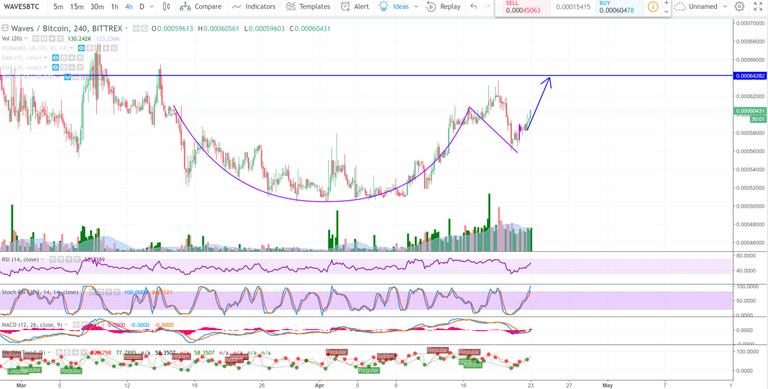
As a final word, we should spend a few moments on the alts. Many are showing very similar chart patterns. Following heavy falls – much like bitcoin – they have bottomed out, come off their lows and broken through downward-sloping resistance. Many are also showing a classic cup-and-handle pattern. This is a technical formation that suggests a slight pullback before more significant rises.
Red hot news, scorching wit and searing opinion pieces from Crypto Inferno.
Join us on
Telegram: https://t.me/crypto_inferno
Reddit: https://www.reddit.com/r/CryptoInferno/
Twitter: https://twitter.com/CryptoInferno_
Facebook: https://www.facebook.com/CryptoInfern

best desktop app for view cryptocurrency stats and signals https://usignals.com
Everyone commented that he would go upstairs.
If there is a chance of falling @crypto.inferno
You think like a hedge fund manger / someone who has been doing this for a long time. I agree with your psychological levels. I think once we can get past the $12k level, price will pull back, then move to $17k. Once we get back to $20k we will have to read price action to see which direction we are headed next.
PS - love the bull dancing....lol.