just yesterday I was seeing the same thing, 100% correct with the analysis.
I support my opinion is that I could continue making fractals in the low.
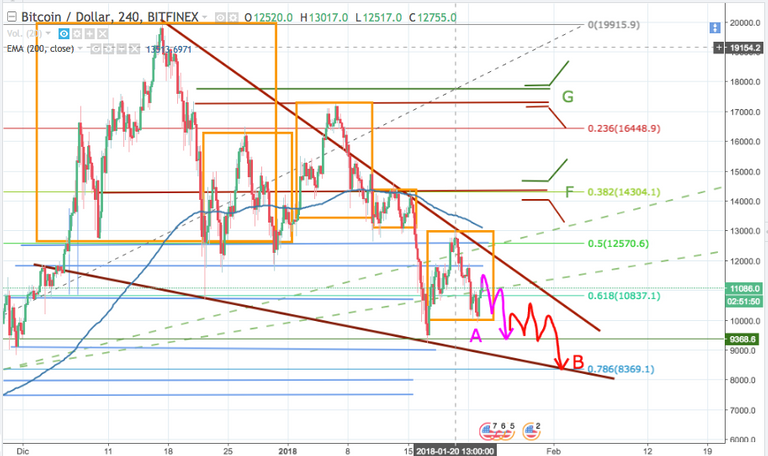
The first fractal calculation that could reach 9300. And the second reach the trend line.

Yesterday's BTC graphic moving in Fractals of Shoulder Head Shoulder
I like your graph and agree for the most part.
The pattern shows a deep dive after each h&s pattern so the last pattern may not appear. At least that's what I'm hoping this has been painfully slow.
My TA has come to essentially the same conclusion with different indicators and pattern analysis.. so I would agree https://steemit.com/bitcoin/@pawsdog/1-25-2017-the-market-view-and-trading-outlook