Everything in the Universe is subject to cycles. Someone is born, someone dies. Something begins, something ends. This also applies to the financial and cryptocurrency markets. Something rises, and something falls. Bitcoin is also a subject to the same laws. It was born, and it died. And then it was reborn even stronger, and died again. And then it did the same several times more each time becoming stronger then before. Is there something strange here? Normally when something dies it dies and never comes back. But Bitcoin did. And probably it will do it again. And again. And again...
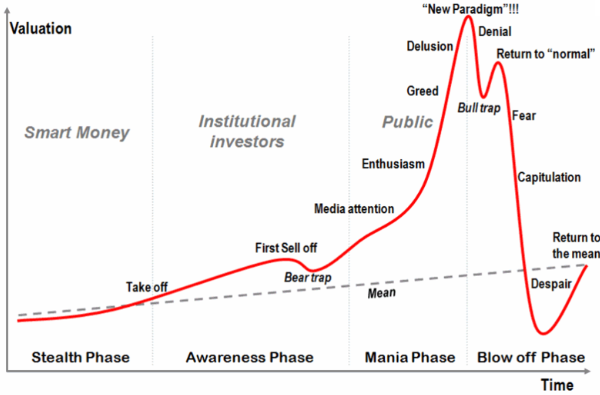
Studying the chart of Bitcoin you can see some clearly visible and repeatable patterns. The similarity to the fractals is imposing. First, have a look at the picture below (Pic.1). It shows typical and well known market bubble chart.

Source: https://transportgeography.org/?page_id=9035
This chart also represents the most important price action in the whole cryptosphere. Remember this shape and be aware which point on this chart corresponds to the current market situation every time you make any crypto trade.
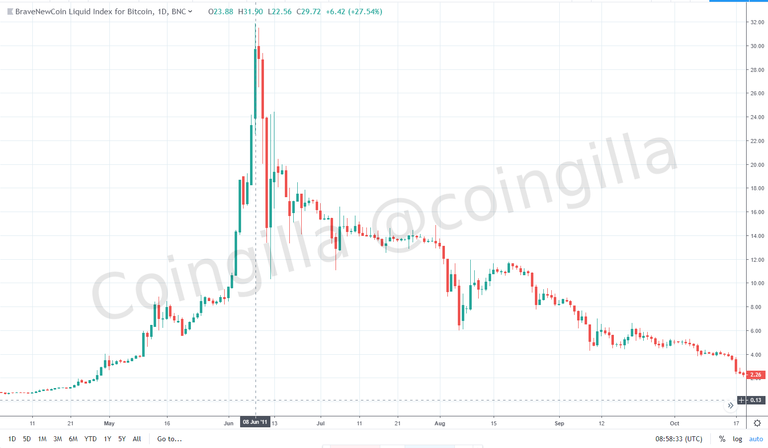
Now, compare this picture with the one below showing Bitcoin developing its price peak on 08th of June 2011 (Pic.2)

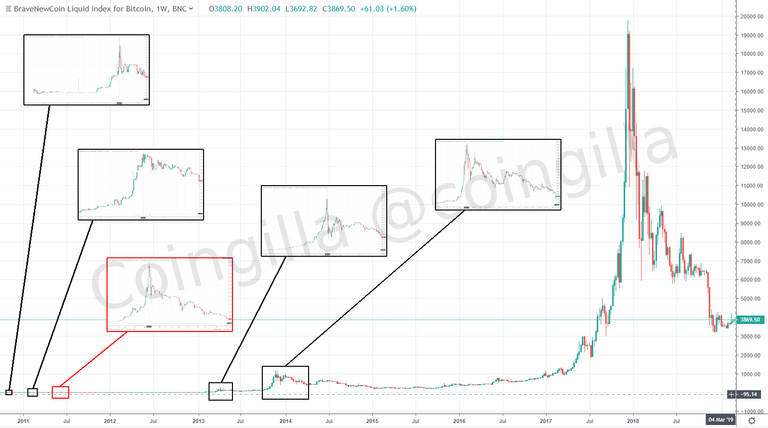
As you can see it's very similar to the textbook example just presented. But there are more interesting things. If you look at overall Bitcoin chart (Pic.3), you will notice that it generates such patterns over and over again the same way like fractals do.

Take a closer look. The part of the price action from 2011, which was zoomed in on the previous picture, is marked with a red rectangle here. Notice how tiny this peak is comparing to the last ATH (All Time High) from 17th of December 2017! And what's even more puzzling that every next bubble pattern is located above the previous one. It means that price is successively generating higher lows and higher highs over time. This observation drives us to a very important conclusion.
Next chapter:
<< Home |
Bitcoin key trend >>