[UPDATE] XVG has bounced off the support line around 790. It may waver here.
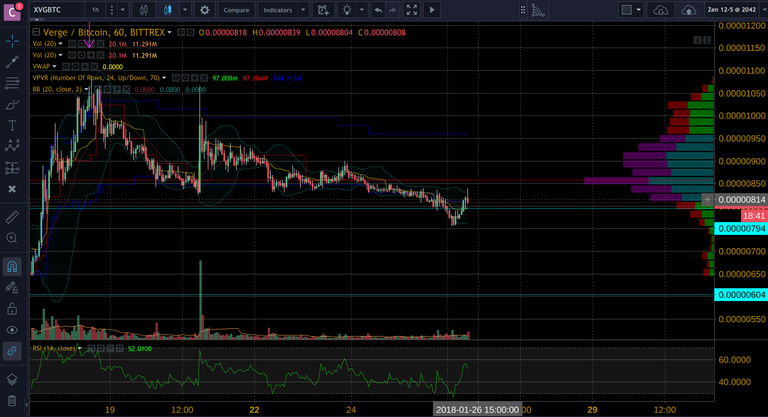
Verge likes to play with fractals:
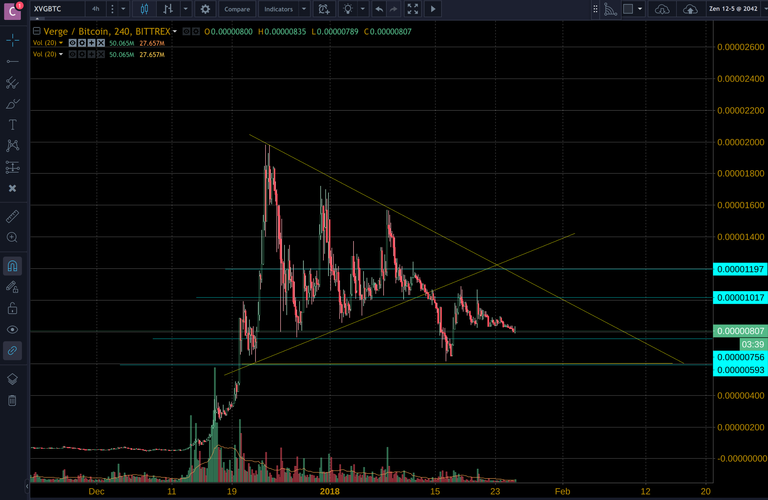
This was seen several months ago before the all time high. I planted horizontal rays where some notable support bases are. Always be trying to identify where the support and resistance lines are.
Below I also placed a set of Fib Ratios:
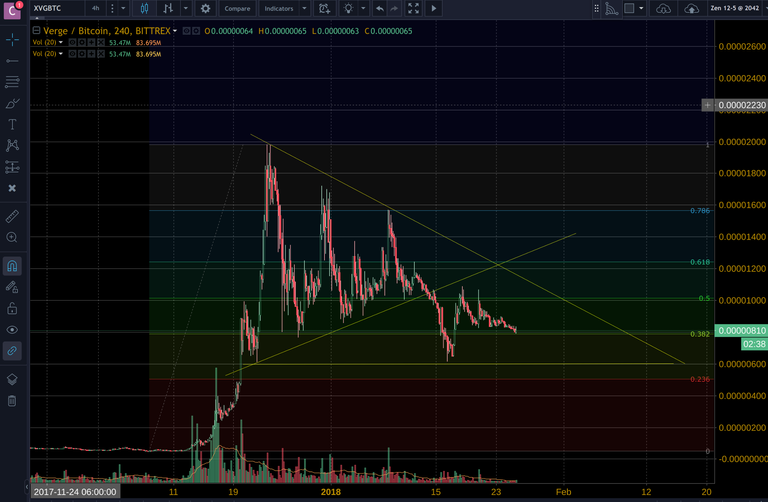
These agree pretty well with the previous pic's support bases. As you can see we are currently courting the 0.382 line. This is a major decision point!
Next, we have a few more indicators including visible range, RSI, Bollinger Bands, VWAP, Volume, etc.
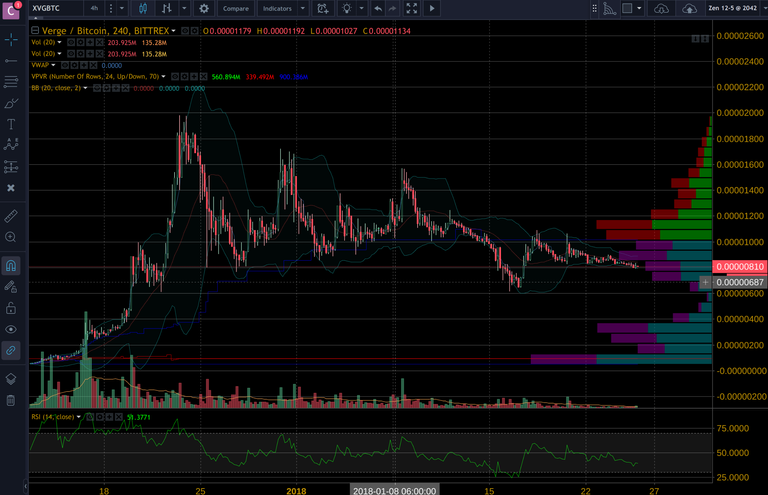
The majority of the verge in the window was traded around or below 100 sats, which with hindsight makes one nauseous. We could just as easily see it pop down to near 600 as we can go to upper 1100s! Maybe consider laddering/graduated buys/sells as possible strategies. Make sure you always win buy being on both sides of the fight.
That's how war profiteers win every war, by selling consumables to both sides!!
A 2.5 week view of the last major fractalized settling pattern (diminishing volume) make me think we could see prices between 800-950 fairly soon:
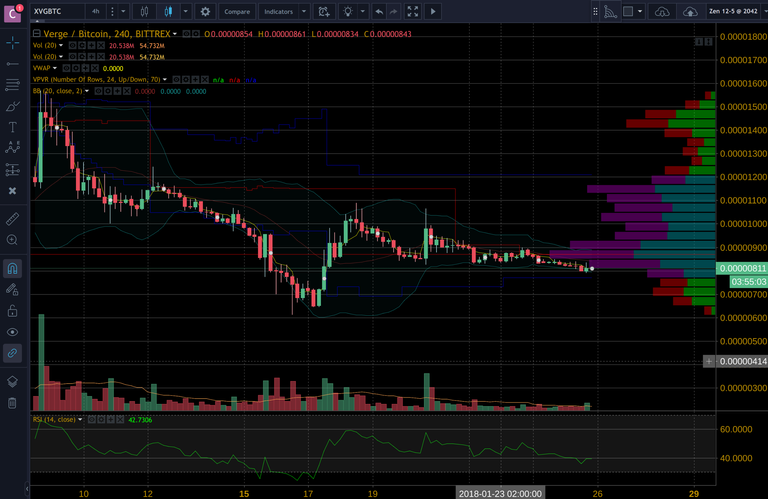
Bollingers are showing a decrease in volatility. The market could do something drastic soon. Careful out there!
Zooming back out we can see these points at which support bases were tested:
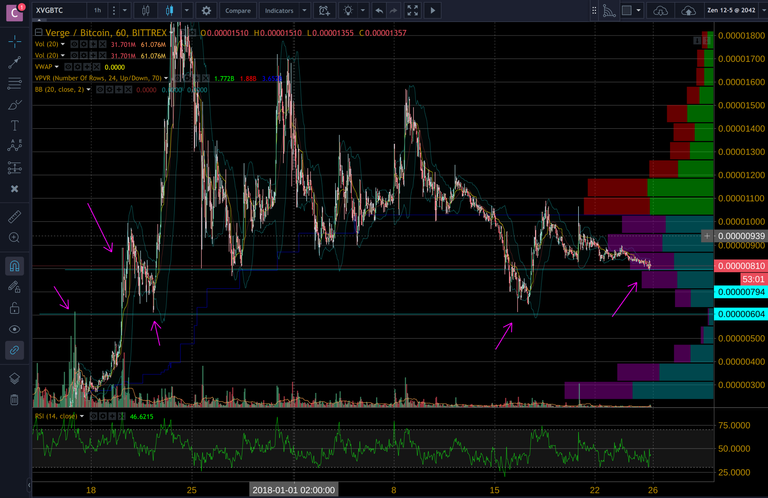
These bases are points of interest. Keep your eyes on the VWAP and those bases.
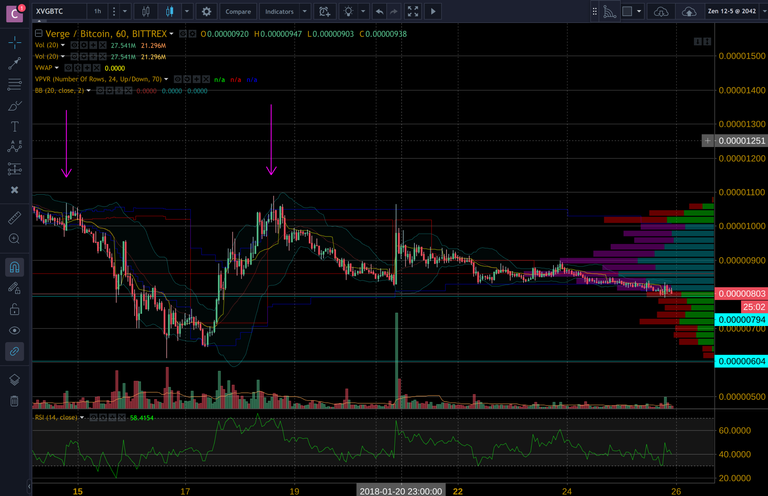
We could easily see an oscillation between 800-1000 if the support base is respected:
Are you self taught? One day I would love to learn how to chart like you.
Hello @importanteye, yes. @cloudconnect is a team, but we are all self taught. we used online resources and networking to learn how to read charts. We are all still noobs compared to some vets out there.
One recommendation i can give is to look up indicators and study them to see if they can help you. Visible Range, Volume, VWAP, TTM Squeeze are a few examples for a volume-based analysis.
Please upvote us if you found our post entertaining!