Welcome to CloudConnect Studios
The MultiMedia CrytpoSource

basic reading level
This is the second part to a 2 part tutorial on Moving Average indicators.
First thing's first....
the price does not always return the wicks
In the case of manipulation, sometimes wicks will be created to sculpt the perspectives of observers. False wicks to create signals are used left and right to get weak hands to drop their money and run.
That aside let's talk some wicks!

BOOM!
I called that one about a week ago, and Im making a killin on it.
When you see a big wick like that you can almost be guaranteed it will return.
On a Candle stick, the body is where the open and close prices are. The wicks are where the price went in between open and close time. That means someone did a trade well below or above where it is now, if it's a large wick.
There are a lot of interpretations to wicks and candle formations. This is coming from a 300+ year Japanese tradition of market analysis. The link above and this one are cool intro resources into some of these formations.
When you're using MA and wicks to find out where to play and what, you can pick out a good wick and wait. You can interpret MA as an indicator for movement and momentum. The larger MA have more weight and take more force to move.
This Tutorial is going to be pretty short since the wick concept is pretty simple.
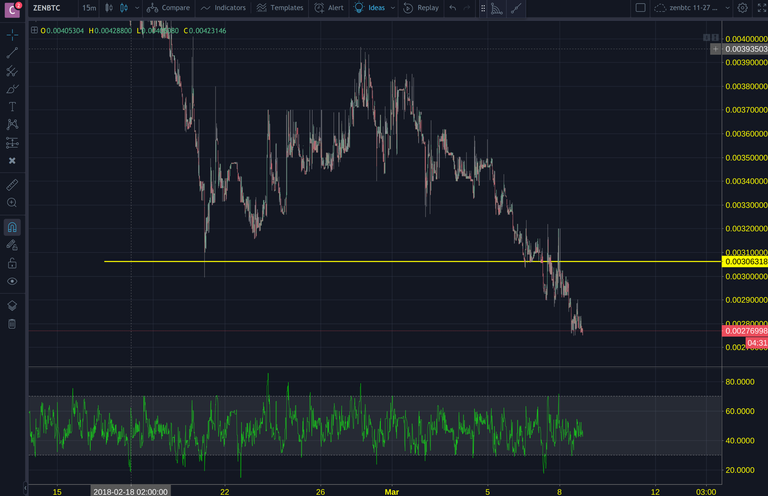
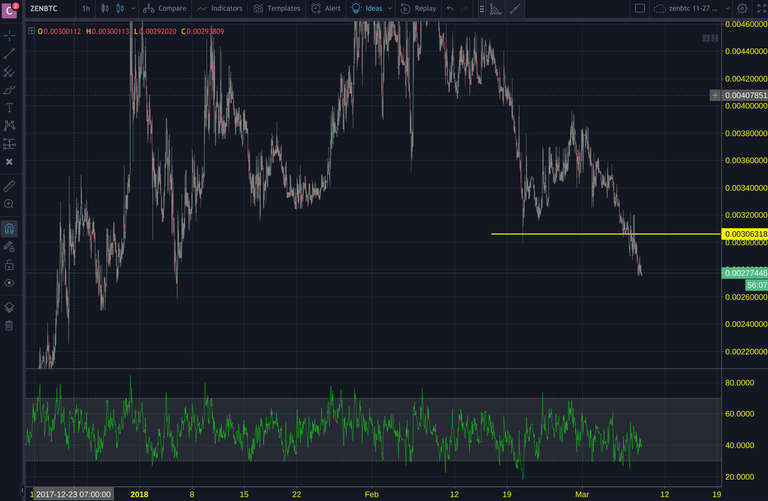
If, like in the picture above, the wick is not only filled by at least 50-75%, but also surpassed, look for a previous wick for guidance.

I didn't find a wick for this one, but let's be for real: you aren't looking for wicks just to find wicks....
You're looking for support levels!!!
Indicators aren't the truth. Look at the word. It is indicating for something else, my friends.
You can prob use any legitimate indicator in the world and in the end we are all looking at the same thing, for the same things.
Indicators are one way to interface with the market and to find the deeper meanings behind why they fluctuate. If you look at charts, try looking at control theory in electronics, or sound engineering. You will find endless analogues in the universe because it really is all the same thing: energy oscillating.
Open your eyes and see energy for what it is, find your path, find your cloud.
Hopefully this has helped to connect you to that. That's why we are CloudConnect. We hope to facilitate your connecting to the "cloud:" the collective. Let's learn together!
Peace,
CloudConnect
This post has received a 2.53 % upvote from @booster thanks to: @cloudconnect, @cloudconnect.
You got a 1.69% upvote from @buildawhale courtesy of @cloudconnect!
If you believe this post is spam or abuse, please report it to our Discord #abuse channel.
If you want to support our Curation Digest or our Spam & Abuse prevention efforts, please vote @themarkymark as witness.
This post has received gratitude of 2.73% from @appreciator courtesy of @cloudconnect!
even though steemit is proof of brain and you're a bot, I still love the work the human behind the bot has done.