Hello guys, so we'll be talking about bitcoin price , i know that most of you are not feeling good right now because bitcoin is having a bad beating and we can't say on when the strong bull will show up to defeat the bear. Now, we'll going to take a look on the chart of bitcoin last year compare to now to give you a little bit of hope as you HODL your coins.

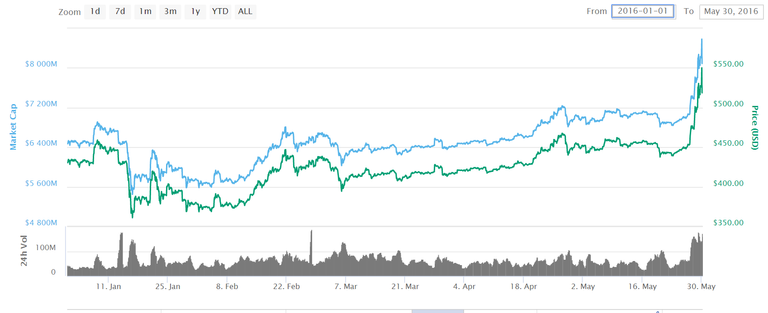
The above picture is the chart of bitcoin on January 1, 2016 to May 30, 2016. As you can see on the chart, same on february this year, bitcoin had suffered a bad beating that became the all time low bitcoin price this year.

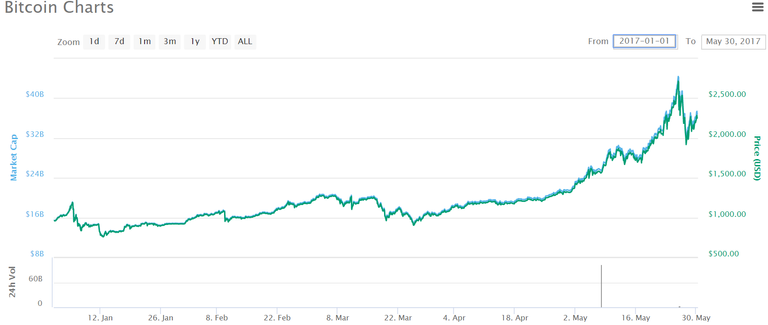
The above picture is the chart of bitcoin on January 1, 2017 to May 30, 2017. Same with the 2016 chart, all time low happened on the current year happened on February.

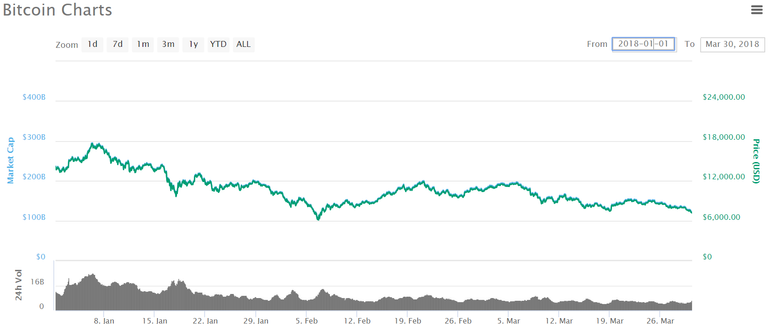
The above picture is for this year and as you can see, the chart of 2016, 2017 and 2018 are almost identical. We can see that the all time low of the current year always happen on between last week of January and First week of february, Also that the market starting to crawl back on April and it's mooning always on May!. So cheer up guys! HODL your coins, bitcoin will start to crawl back slowly on it's ATH next month. If you find this blog informative, kindly comment below and upvote. Thank you so much :)
Thank you all for your upvotes :).
Congratulations @chin0327! You have completed some achievement on Steemit and have been rewarded with new badge(s) :
Click on any badge to view your own Board of Honor on SteemitBoard.
For more information about SteemitBoard, click here
If you no longer want to receive notifications, reply to this comment with the word
STOPDo not miss the last announcement from @steemitboard!
I also believe it will rise back up again.
Yah! Just believe :)
Great Blog.
thank you so much bro :)
Wow dear your analysis is too strong. Good job. Congratulations dear.
Great information
I already started to follow you, I hope for your support.