We're moving up... but is this the start of the next BULL run?
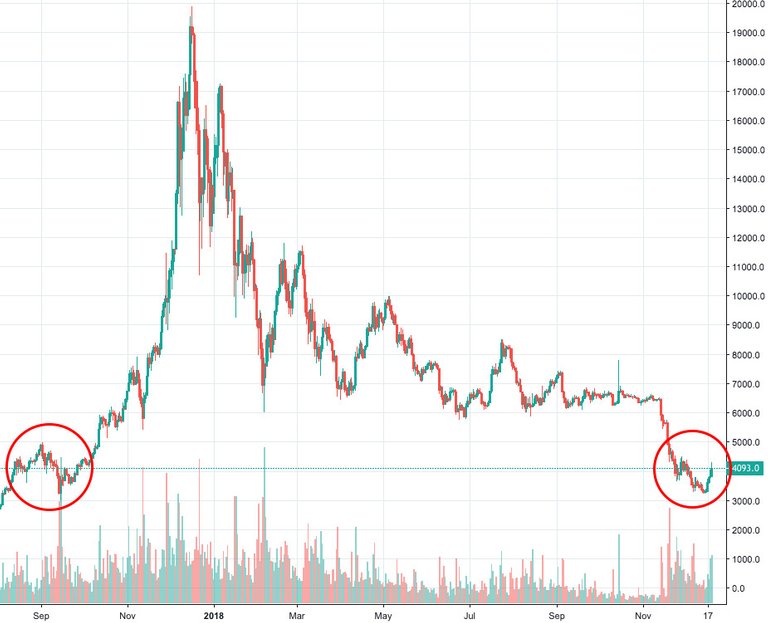
Let's look at the daily price chart.

Last year between August and November we tested pressure at the $4,000 dollar mark.
We tested above $4k and then fell below it.
Then we tested it again, and fell below it.
Then we broke through.
Fast forward to today and we seem to be going through the same test cycle.
We fell below $4k on November 24th.
3 days later we pushed back above $4k.
We tested it again with a quick back and forth 2 and 3 days later.
2 days after that we fell below and now we're pushing above again 16 days later today.
$4,000 USD is a Hurdle
If we can get over this $4k hurdle it may be the start of the next bull run.
It's too early to tell as we continue to test $4k.
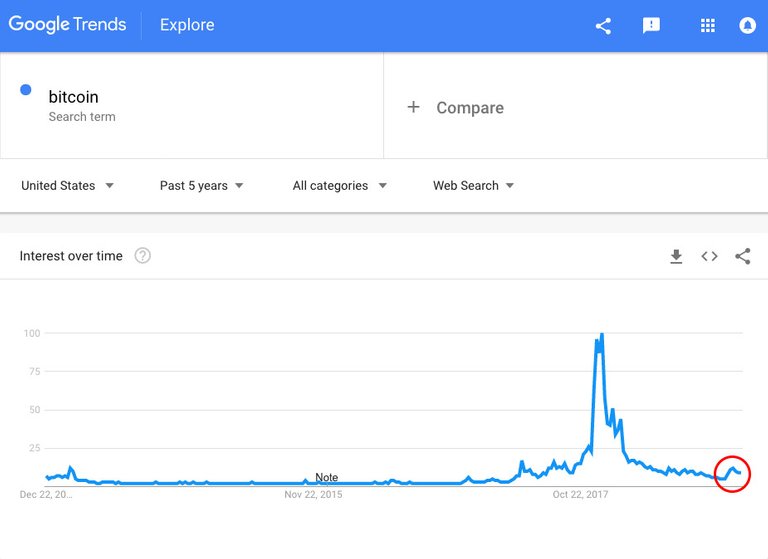
Google Trends may show us some insight.
Here is a look at the 5 year trend for the search, "bitcoin".

That red circle is at mid November.
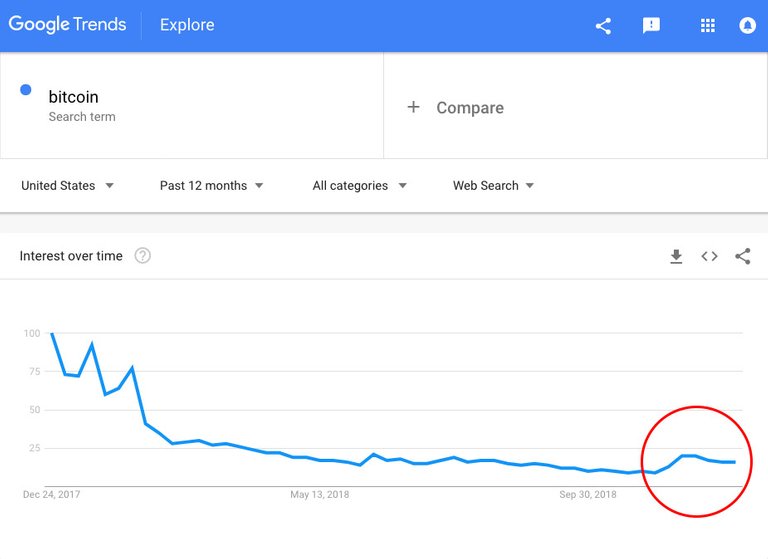
Let's zoom in to the 12 month view.

It's not much but it's reminiscent of the last time we tested $4k back between August and November of 2017.
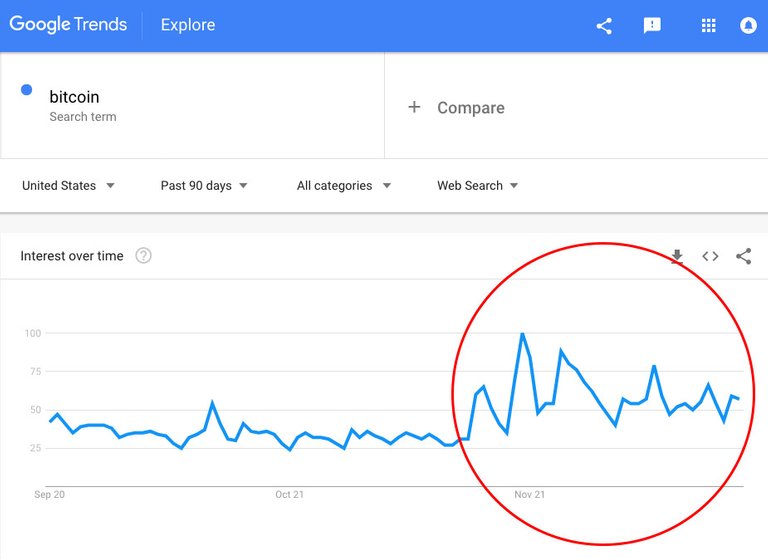
Let's zoom in to the 90 day view.

Here, we can see a clear spike in interest in bitcoin at around mid November.
Remember, it was November 24th when we fell below $4k.
Clearly, there was an interest building up right before we tested $4k.
As soon as we dropped below $4k we began to test it again.
What does this mean? Time will tell.
Congratulations @campfire! You have completed the following achievement on the Steem blockchain and have been rewarded with new badge(s) :
Click here to view your Board of Honor
If you no longer want to receive notifications, reply to this comment with the word
STOP