A few technical analysis patterns consistently appear in crypto, especially bitcoin, and are easy to prepare for. Known as classical charting patterns, many of these formations are a combination of a certain set of highs/lows that form into triangles, wedges, trends, flags etc.
Today's lesson is on rising wedges:

What's a rising wedge?
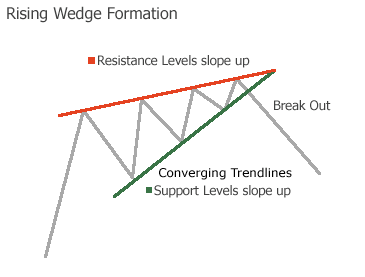
A rising wedge forms after an upward movement in price, and is a reversal pattern. It forms from contracting price action towards the end of the wedge as seen above. 2-3 touches of the top resistance line is needed for confirmation. Declining volume is also a great sign of a falling wedge playing out. Common equation: Falling volume + increase in price = weak move. Upon break of support below the trend line, breakout volume should increase and confirm the pattern playing out.
Usually there is a throwback to the bottom trend line after break of support, as that trend line becomes resistance. Once price re-tests this area, it can move down further.
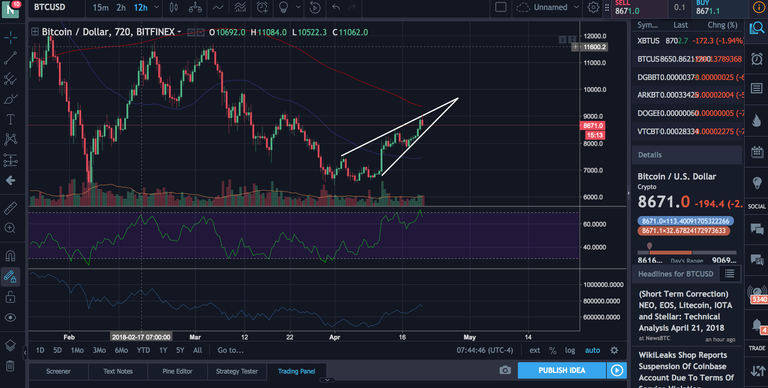
Here's Bitcoin, currently, on a 12h chart. A rising wedge has definitely formed. The way to play this is simple. As a breakout trader, I'd place a short sell, limit order upon break down of the support level with my stop loss at about $9k.

I'll update what comes next and how this pattern plays out.
Yours truly,
BullsVsBears
Follow me on
Check these articles out if you like money
SMASH THAT LIKE BUTTON
Good info for the new traders, and sure there are a lot of new traders who are first exposed because of crypto. Sure, this patterns are forming due to market psychology, but personally if looking for long term positions, I trade the breakouts and not the formations. This way positions are safer to hold for a longer term.
Same.."As a breakout trader, I'd place a short sell, limit order upon break down of the support level with my stop loss at about $9k."
That'd be a good spot. While everyone screaming that bulls are back, I'm still cautious on how the markets have been playing. It's like mirroring the 2014 bear market. That $1k increase looks like how it happened back then and searched for new lows before really recovering.

Agreed
Great post @bullsvsbears
Recently I have noticed as well that there is many falling wedges, rising wedges, ascending pennants, descending pennants, and triangle patterns. I think this has to do with people treating crypto as a speculative investment, instead of investing in the technology the cryptos are providing.
Keep up the good work, cheers :)
Yeah for sure, the patterns play out due to market psychology and human emotions. I like to look at the long term TFs to get a better idea of sustained moves.
It's good to see that you are also creating contents over trading patterns and strategies. I like your post; simple and clear. I wish you continued success 😌
Thanks mate!
@bullsvsbears Nice post. Pretty good rising wedge on LTC today ;)
A lot of newbie traders can spot these patterns - but how many can trade them and be profitable?
These patterns should be used as confluence to form 1 part of a trading plan and not used solely as an 'indicator' to enter into a trade.
100% agree