
On July 29th, I posted the chart below in this steemit post, that showed you two positive patterns in Bitcoin's price chart.
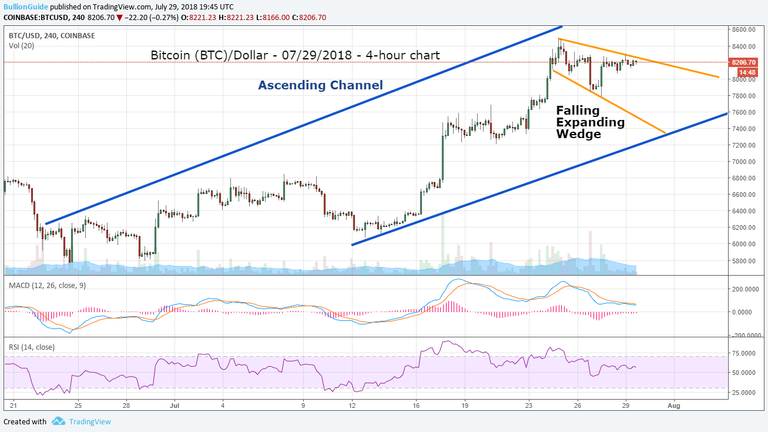
In previous posts, I've stated that Ascending Channels are meant to be broken, which was noted in this steemit post, where Bitcoin (BTC/USD) broke the channel to the upside.
But now, Bitcoin (BTC/USD) has broken below its 'Ascending Channel,' as you can see in the chart below.
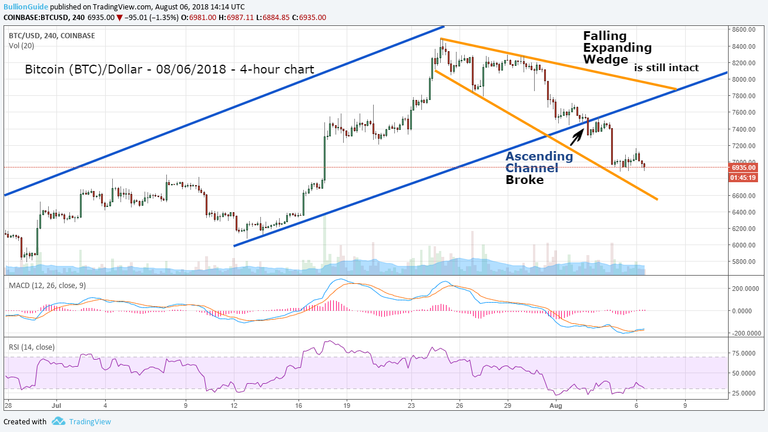
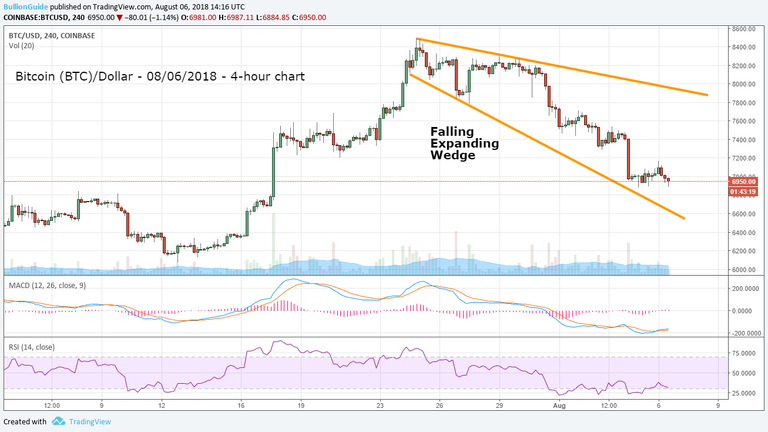
But, not all is bad for Bitcoin, the positive 'Falling Expanding Wedge' that was identified in the 7/29 post is still intact.
For Bitcoin (BTC) to confirm the Falling Expanding Wedge pattern, it will need to rise above the $7,600 price level. Time will tell how soon that will happen.
I'll follow up after the pattern has either been confirmed or denied, and a new pattern has taken shape.
Disclaimer: This is not financial advice.
The Charts provided courtesy of TradingView.com
Normally, I write about Gold Nanoparticle Cancer Research and I do technical analysis for silver, gold, and the U.S. dollar, but I'm also a fan of cryptocurrencies, and because of this, I've started to share my charts on the coins and tokens I own or follow.
My website is called: The Free Bullion Investment Guide, it offers anyone interested in the precious metals bullion markets an honest place on the web that provides bullion market reference material, bullion market news, and other market-related information. http://www.free-bullion-investment-guide.com/
Lastly, the bullion guide supports and sponsor's Gold Nanoparticle Cancer Research, half of every dollar it earns goes to this research through The Angel of Healing Cancer Research Fund. (This includes the money earned through steemit)
Thank you for your time and God Bless,
Steve Warrenfeltz
Every Vote is Appreciated! Thank you.

Let's keep an eye on that wedge... Thanks for sharing.