BTC TA ANALYSTS DAILY SUMMARY - JUNE, 2nd

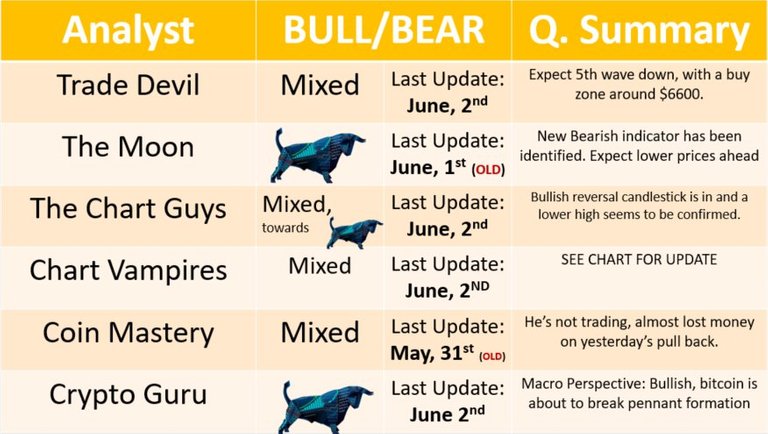
Analysts Sentiment Summary
Detailed Summaries:
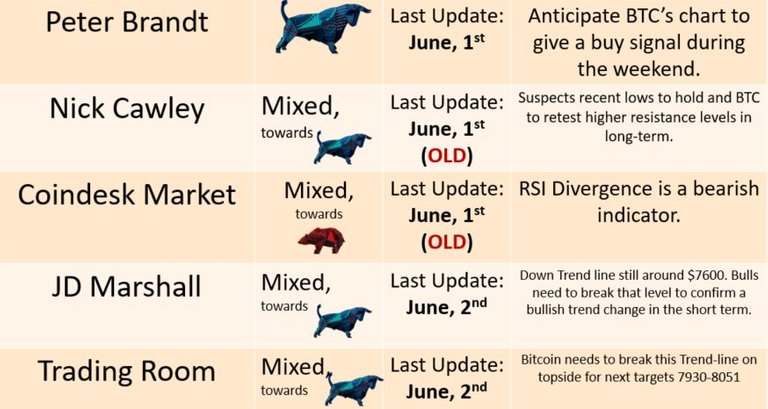
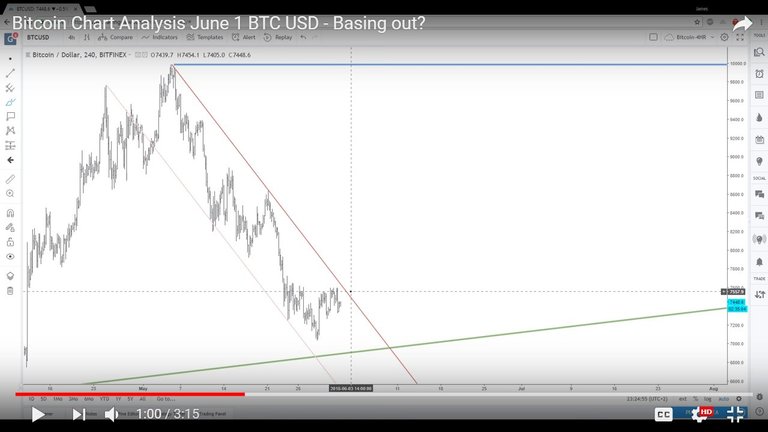
JD Marshall
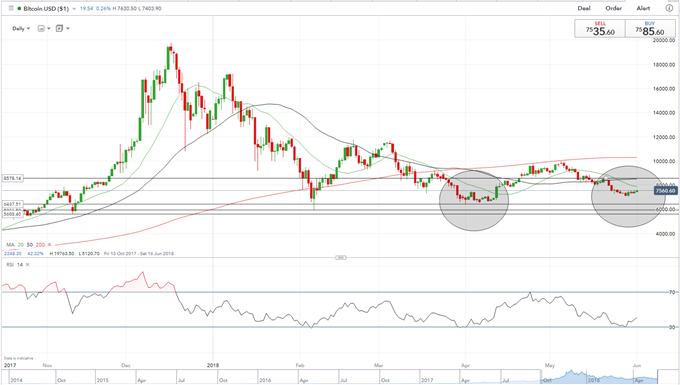
Down Trend line still around $7600. Bulls need to break that level to confirm a bullish trend change in the short term. JD Marshall is still of opinion that the macro trend is still bullish (green line). On the chart he also shows the previous top of $9990 that would need to break, if we are to see a bullish march upward for the rest of the year.
@chartguys
Bulls showed up and we've seen a recovery. His call of the top being in yesterday prooved out to be wrong. We've broken a key resistance range around $7600. The bullish reversal candlestick is in and a lower high seems to be confirmed, even though we have a little bit to go still.
Very Bullish Scenario: If higher low is in, we'll eventually break the resistance around $10 000.
Med. Bullish Scenario: BTC climbs a little more, achieves a higher low around th end of June.
Bearish Scenario: BTC climbs a little to lower high, followed by a sell-off and breaking the previous low of $7058.
On the daily frame the trend change upwards remains unchanged.
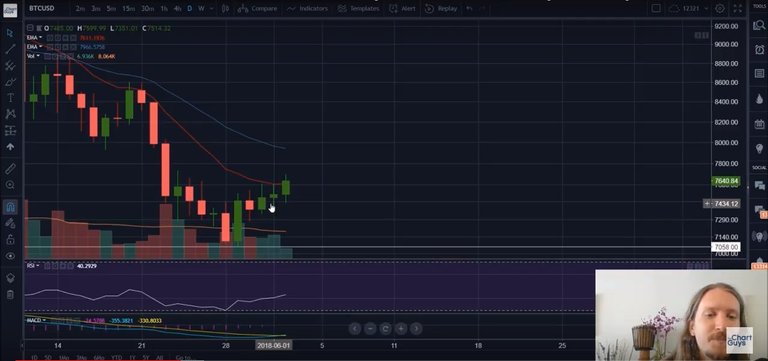
On the four hour chart BTC's recent bounce have lasted for more than 5 days, which is a good sign. The previous two bounces only lasted for 2 days each (during the 14th & 19th). The bear volume have steadily declined, which is also a good sign.
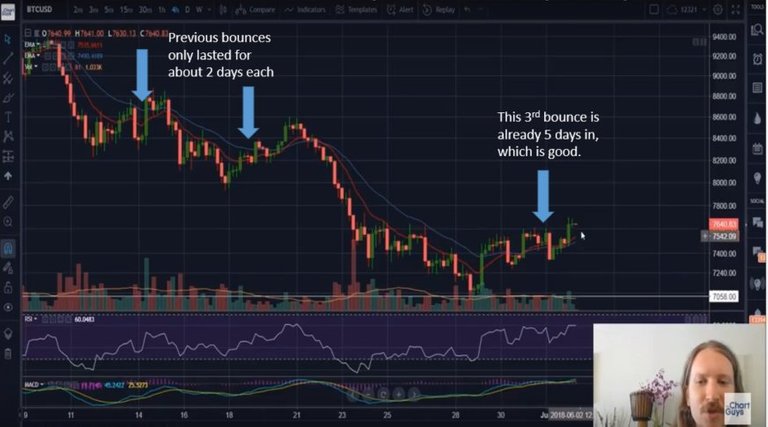
Also, for all the short-term traders BTC has been pulling back every time the RSI hits the 70 mark. This just happened, so expect a short pull-back on the hourly.
The Moon
(NO NEW UPDATE)
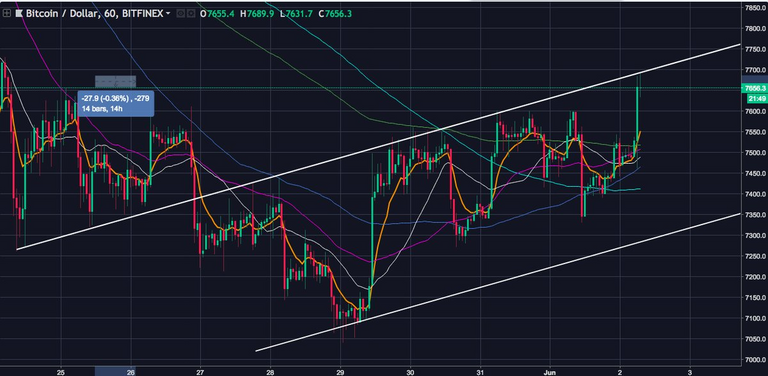
Bitcoin reversal from the triple bottom (from the pennant formation) is a good sign. However, on the one-hour chart he has identified an ascending wedge which is a bearish pattern, which might indicating lower prices in the short term. An ascending wedge can either be an indication of a bearish trend continuation or reversal from a recent bullish run. In the current situation it would indicate a continuation. Also, the ascending wedge is converging with the recent resistance level of $7600.

Coin Mastery
(NO NEW UPDATE)
Recent "Bart Simpson" tendency in Bitcoin, where price shoots up and down, is a clear indication of algo-trading. He is of opinion that the macro trend is upwards though. In his opinion the markets are currently high risk. He's currently in 'watch mode' and not trading. He hopes for a higher BTC price (around $8100) which would confirm an uptrend, before climbing back into the market.
chris L $ChartVampire$
Posted the following without any commentary. See chart for update.
Peter Brandt
(NO NEW UPDATE)
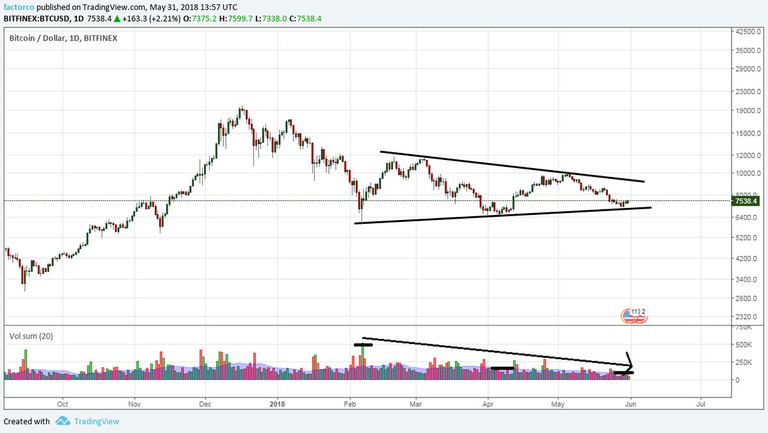
That said, he also notes that the trading volume has been diminishing since February. He notes the following regarding volume: " $BTC since 6Feb low, especially volume contractions at three intermediate lows. Sign of supply drying up, but we still need a WBB day up on expanded volume to gain some confidence"
Peter's anticipating a chart buy signal to appear during the weekend. As of writing he has not given a buy signal yet.
Nick Cawley
(NO NEW UPDATE)
The largest cryptocurrency ends the week marginally higher and is currently building a base for a potential move higher, while the RSI indicator sees BTC bouncing back from oversold territory. BTC has good support between $5603 and $6438 and is unlikely to threaten support in the short-term – all things being equal. On the upside $8578 looks a likely first target before the coin re-tests the recent the recent high just above $10,000.
Trading Room
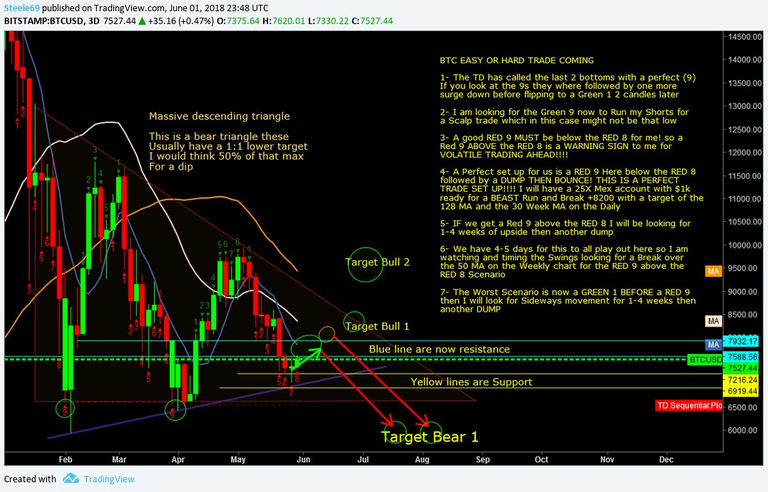
Bitcoin needs to break this Trend-line on topside for next targets 7930-8051
Margin Traders can SHORT that area for a quick 350 Points
Our Medium Term View is still Neutral with downside bias until we see $BTC close above 50 Week MA
@tradedevil
Primary Bullish Count: BTC just finished 4th wave, expect 5th wave down, with a buy zone around $6600.
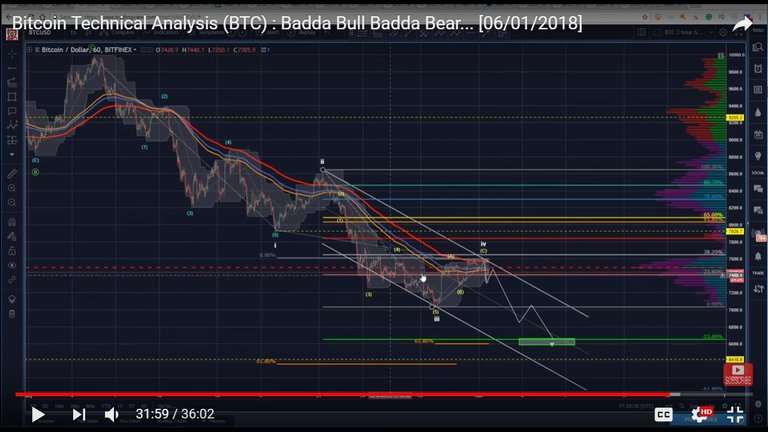
Secondary Bearish Count: BTC just finished a 1,2 Wave, which will indicate much lower prices. More clarity will emerge during the weekend.
Crypto Guru
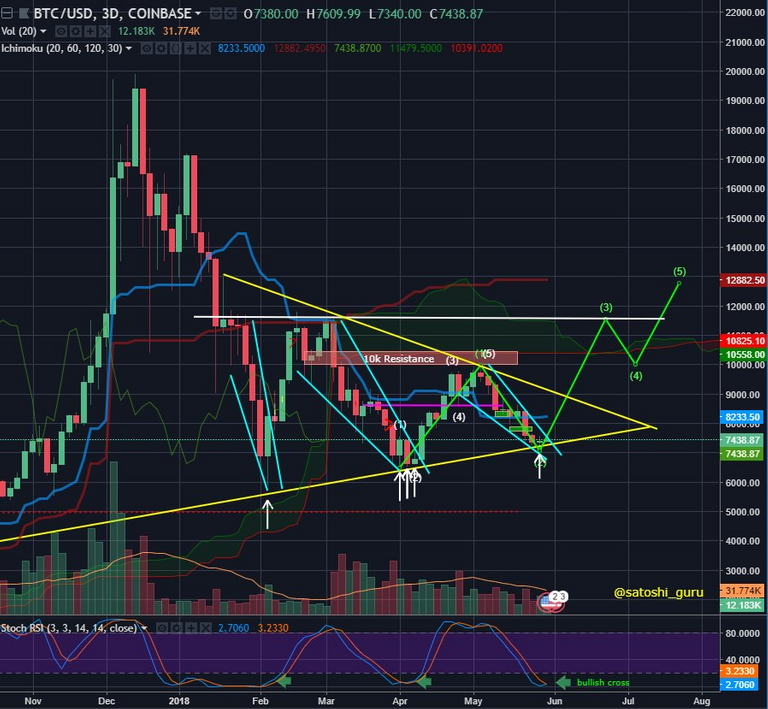
Commentary below: FYI CryptoGuru's count seems similar to @tradedevil . Definitely something to keep an eye on.
Mini Falling Wedge (teal) within a Massive Wedge (yellow). We faced the same exact situation at the start of Feb & April; except this time he believe we're ready to break through the Massive Yellow Wedge.
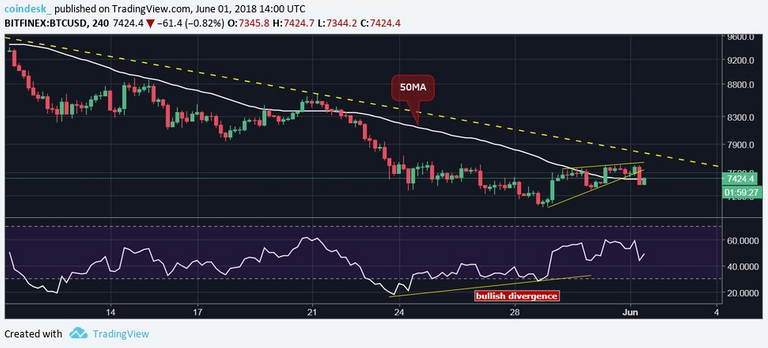
Coindesk Markets
(NO NEW UPDATE)
The bullish RSI divergence has ended in a rising wedge breakdown, indicates sentiment is quite bearish.
$7K could be tested if the 4H candle fails to retake the 50MA.
Bulls need a clear break above $7,580
Also, a shout out to @famunger for his daily Analyst Summaries over the past months.
Congratulations @btc-hunter! You have completed some achievement on Steemit and have been rewarded with new badge(s) :
Click on the badge to view your Board of Honor.
If you no longer want to receive notifications, reply to this comment with the word
STOPTo support your work, I also upvoted your post!