The market is finding it difficult to sustain the total cryptocurrency market capitalization above the $200 billion mark. The news of the U.S. Securities and Exchange Commission (SEC) suspending trading in the Bitcoin Tracker One and Ether Tracker One securities has further dampened the sentiment.
While the total market cap has declined sharply from the start of the year, it is still higher than it was a year ago. On September 10, 2017, the total market capitalization was about $140 billion. This shows that the current fall has only removed the excess froth from the system, which is bullish from a long-term perspective.
Ethereum (ETH) co-founder Vitalik Buterin believes that the space is unlikely to witness another 1000-fold growth. We have also maintained that a repeat of the last year’s powerful rally is unlikely, but the growth in this sector is only starting. As its adoption increases, the activity of both retail and institutional investors will provide another boost to the prices.
However, it is advisable to wait for the prices to show a bottoming formation before buying. Let’s see if we spot any reliable buy setup in any of the top cryptocurrencies that we track.
BTC/USD
Bitcoin is currently attempting to bounce off the $5,900–$6,075.04 support zone, but is facing selling just above the $6,400 mark.
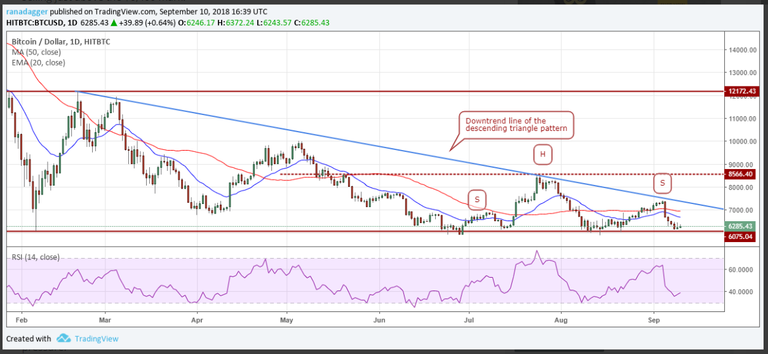
A bearish descending triangle and a head and shoulders pattern have developed but they will complete only on a breakdown and close below $5,900. Until then, the patterns are not considered complete.
Though the pattern targets of a breakdown are way lower, we shall watch the $5,450 and the $5,000 levels on the downside. Both moving averages have turned down, which shows selling pressure.
Any attempt to recover will face resistance at the 20-day EMA and the 50-day SMA. A breakout above the downtrend line of the descending triangle will indicate a probable change in trend and a move above $7,413.46 will confirm it.
As long as the BTC/USD pair sustains above $5,900, we remain positive about a pullback to $8,566.4. Therefore, we shall propose a long position if we spot a buy setup. Until then, we suggest traders remain on the sidelines.
ETH/USD
Ethereum has continued its journey southwards. It has dipped below its pattern target of $192 and made a new 52-week low at $185.12 on September 9.
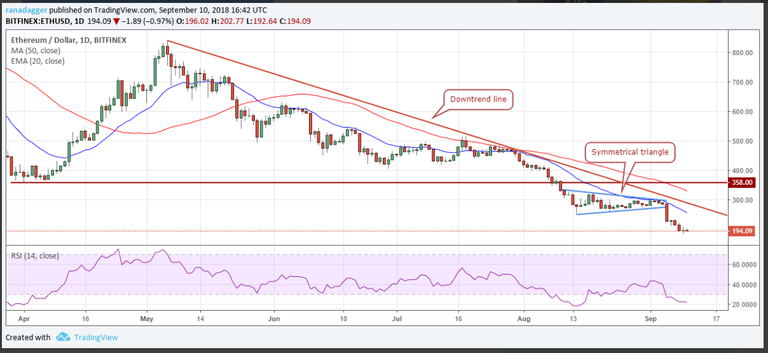
The next support to watch on the downside is $176. Though the trend is down, the RSI is deep in the oversold territory, which points to a probable pullback within the next few days.
Any recovery attempt to the upside will face a stiff resistance at the 20-day EMA and the downtrend line. We shall wait for the ETH/USD pair to end its decline and form a new buy setup before recommending a trade on it.
XRP/USD
Ripple has been trying to hold the $0.27 level for the past two days. A break below this can sink it to the next support at $0.24001.
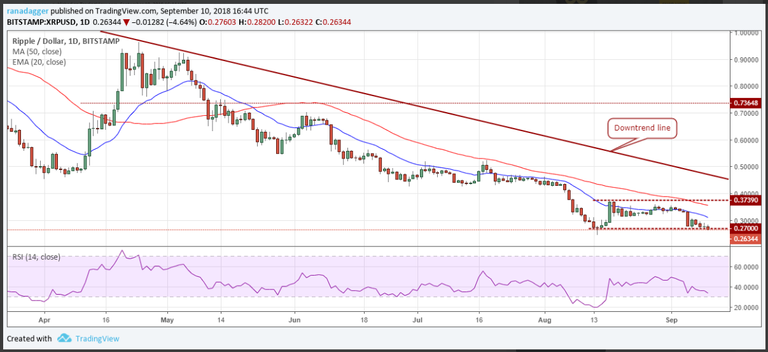
The trend remains firmly down with both moving averages sloping down and the RSI in the negative territory. Failure to bounce from the strong supports is another sign of weakness.
If the XRP/USD pair holds $0.27, it might remain range bound for a few more days. We shall wait for the trend to change before suggesting a trade on it.
Hi! I am a robot. I just upvoted you! I found similar content that readers might be interested in:
https://cointelegraph.com/news/bitcoin-ethereum-ripple-bitcoin-cash-eos-stellar-litecoin-cardano-monero-iota-price-analysis-september-10
Source
Plagiarism is the copying & pasting of others work without giving credit to the original author or artist. Plagiarized posts are considered spam.
Spam is discouraged by the community, and may result in action from the cheetah bot.
More information and tips on sharing content.
If you believe this comment is in error, please contact us in #disputes on Discord