Bitcoin Cash broke below the August 14 low of $473.9060 on September 7, resuming its downtrend. It can now slide to $400.
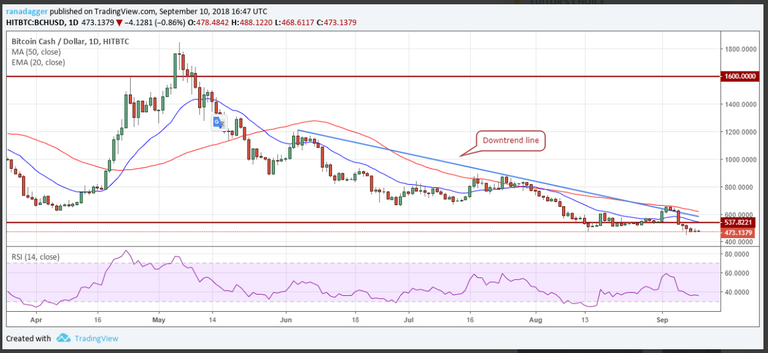
Both moving averages are turning down and the RSI is in the negative territory, which shows that the bears are in command.
On the upside, the bulls will face a stiff resistance at the 20-day EMA and the 50-day SMA. We shall wait for the BCH/USD pair to form a buy setup before proposing any trades.
EOS/USD
EOS has been trying to hold above $4.60 for the past two days, but it is facing selling close to the $5.15 mark.
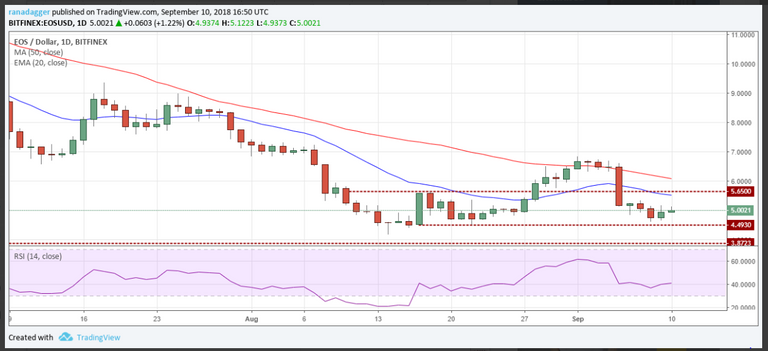
A break above $5.15 can carry the EOS/USD pair to the 20-day EMA, which is just below $5.65.
If the bears force a break below $4.4930, a retest of the critical support zone of $4.1778–$3.8723 is probable. Traders can trail the stops on the remaining long positions to $4.4.
XLM/USD
Stellar has gradually drifted down to the critical support of $0.184, which has not been broken convincingly since mid-December of last year.
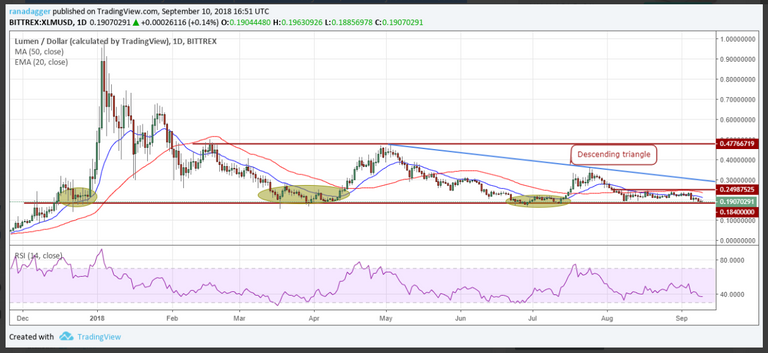
A close below $0.184 will complete a descending triangle pattern, which can result in a drop to $0.11812475 and lower. However, the traders should note that during all of the three previous occasions on which the XLM/USD pair had dipped below $0.184, the bears could not sustain the lower levels. Therefore, the breakdown will be considered valid only if the bears succeed in getting three consecutive closes below $0.184.
We are not suggesting a buy at the current levels because the moving averages have turned down after remaining flat for the past few days, and the RSI is also in the negative territory. This shows that the sellers have the upper hand. We shall wait for buyers to return before suggesting any long positions.
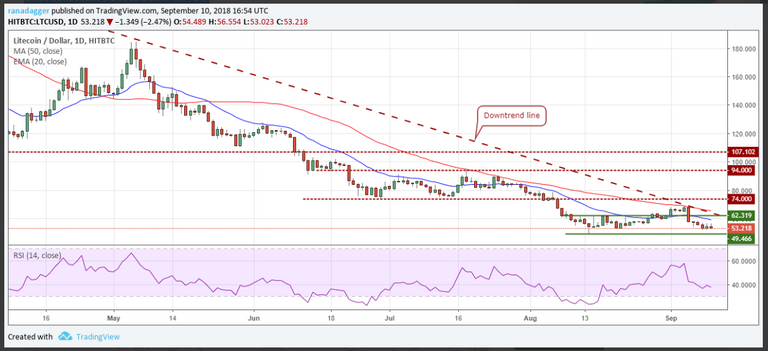
LTC/USD
Litecoin has been holding on to the $52 mark for the past two days, below which a fall to $49.466 is probable.
 ![YYYY.PNG]
Both moving averages continue to trend down, which shows that the sellers have the upper hand. The RSI is also in the negative territory.
The first sign of a change in trend will be when the bulls break out and sustain above the downtrend line. However, after such a long downtrend, the LTC/USD pair will have to spend a few weeks forming a bottom before starting a new uptrend. We don’t find any buy setups at the current levels.
Hi! I am a robot. I just upvoted you! I found similar content that readers might be interested in:
https://bitsmart.io/bitcoin/news/bitcoin-ethereum-ripple-bitcoin-cash-eos-stellar-litecoin-cardano-monero-iota-price-analysis-september-10
Coins mentioned in post:
Source
Plagiarism is the copying & pasting of others work without giving credit to the original author or artist. Plagiarized posts are considered spam.
Spam is discouraged by the community, and may result in action from the cheetah bot.
More information and tips on sharing content.
If you believe this comment is in error, please contact us in #disputes on Discord