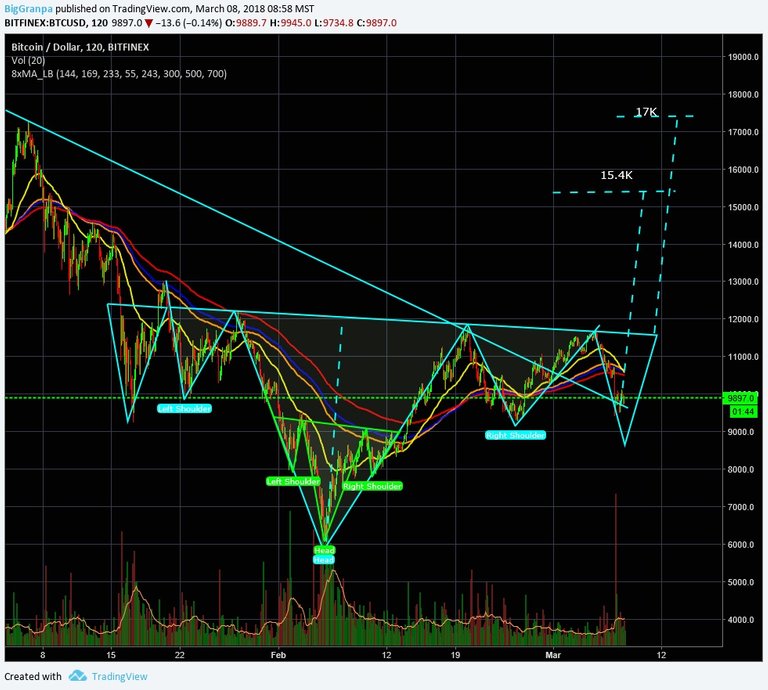
There are Multiple Head and-Shoulders Tops and Bottoms, also known as Complex Formations. They may be described quite sufficiently as Head-and-Shoulders Reversals in which either the shoulders or the head, or both, have been doubled or proliferated into several distinct waves.
A common form consists of two left shoulders of approximately equal size, a single head, and then two right shoulders, again of approximately even size and balancing the two on the left
Still another, of which you will usually find several good examples at any Major Market Turn, consists of double shoulders on either side of a head which is itself composed of a small but quite distinguishable Head-and-Shoulders development.
We have mentioned the tendency toward symmetry in the simple Head-and Shoulders Formation. Patterns of the Multiple or Complex type show an even stronger urge toward symmetry — so strong, in fact, that it may be counted on in determining trading policy. If there are two shoulders on the left, there are almost always two on the right of nearly the same size and duration. (Of course, one does not know that a Multiple is in process of formation until its right shoulder becomes evident.) Except in volume, the right-hand half of the pattern is, in the great majority of cases, an approximate mirror image of the left.
There is something about Multiple Head-and-Shoulders patterns especially pleasing to technical chart followers. Because of their symmetrical tendencies, it is fascinating to watch them evolve to completion. Once completed, however, they may try your patience by their seeming reluctance to “get going” with a new trend. On that account, it becomes easy at times to jump to the conclusion that they have “blown out,” i.e., produced a false signal. Actually, except in the matter of extent of move which we have already discussed, they are fully as reliable as the plain Head-and-Shoulders. False moves are relatively rare with both. And in those extraordinary cases when a Complex Formation does go wrong, it still stands, like the plain Head-and-Shoulders, as a warning that the final Reversal is near.
We can lay down specifications for it in much the same words as we used for the Head-and-Shoulders Top. Here they are, with the portions that differ in principle from the Top printed in italics.
A. A decline, climaxing a more or less extensive downtrend, on which trading volume increases notably, followed by a Minor Recovery on which volume runs less than it did during the days of final decline and at the Bottom. This is the “left shoulder.”
B. Another decline that carries prices below the Bottom of the left shoulder, on which activity shows some increase (as compared with the preceding recovery)
but usually does not equal the rate attained on the left shoulder decline, followed by another recovery which carries above the Bottom level of the left shoulder and on which activity may pick up, at any rate exceed that on the recovery from the left shoulder.
C. A third decline on decidedly less volume than accompanied the making of either the left shoulder or head, which fails to reach the low level of the head before another rally starts. This is the “right shoulder.”
D. Finally, an advance on which activity increases notably, which pushes up through the neckline and closes above by an amount approximately equivalent to 3% of the stock’s market price, with a conspicuous burst of activity attending this penetration. This is the “confirmation” or “breakout.”
re: Technical Analysis of Stock Trends, 9th edition

This is one of the greatest comments I've ever read. Thanks for all the info.
You are welcome, I am glad you enjoyed it.
sweet baby jesus, what a comment 👌👍
Thank you very much!
interesting, has there ever been a Multiple Head-and-Shoulders patterns in btc or other cryptos before?
I looked around several times and couldn't find anything this spectacular.