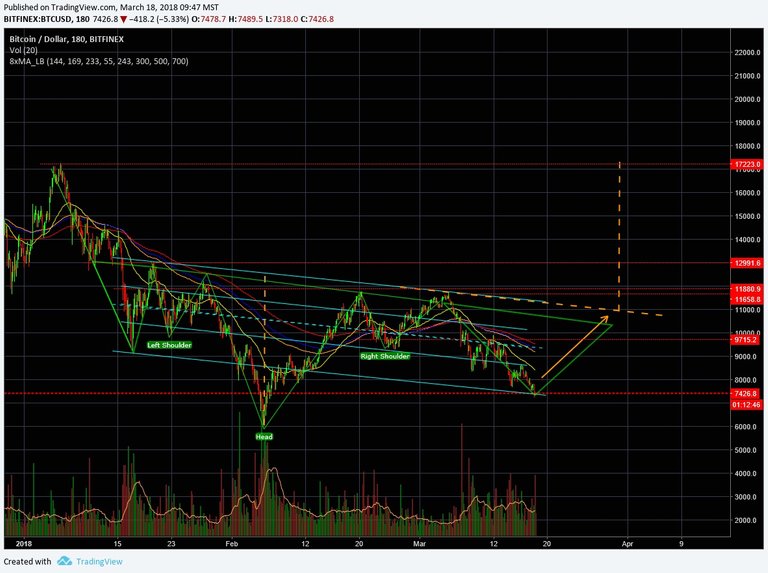
Busted? Or not? Here is the Complex Inverted Head and Shoulders Bottom that has been developing over the past two months on Bitcoin. I have put a down trendline (channel) in blue that signals the weakness of the pattern. I also put an interior channel at approx. fib zones in blue, a measuring tool in orange, nearby resistance lines in red, and the pattern in green.The pattern continues to slow down and spread. IMO, the pattern still signals a reversal, but it is just an opinion and not advice.
Atrapado? o no? Aqui esta el complejo patron llamado cabeza y hombros invertido, que he venido desarrollando desde hace los ultimos dos meses en Bitcoin. He puesto una linea inferior de rastreo en azul que senala la debilidad del patron. Tambien puse una linea de rastreo inferior de aproximacion de Fibonacci , otra herramienta de medicion en color naranja, cercana las lineas de resistencia en color rojo y el patron en color verde. El patron continua disminuyendo su velocidad y a extenderse. En mi opinion, el patron sigue dando senales de revertirse pero solo es una opinion y no un consejo.
You are viewing a single comment's thread from:
The symmetry is pretty off for IHS.
Thank you for your interest, waiting for conformation of 3% above neckline.
If , as you say, TA is a quantum event, then time is of no consequence. If you are saying the price action lacks symmetry, you need to read the chart again.