New Price Target!
...
If you wanna see how we nailed a potential bottom at $8,367, check out my previous analysis on Bitcoin here:
https://steemit.com/bitcoin/@benkalashnikov/3bnsbo-bitcoin-btc-analysis-update
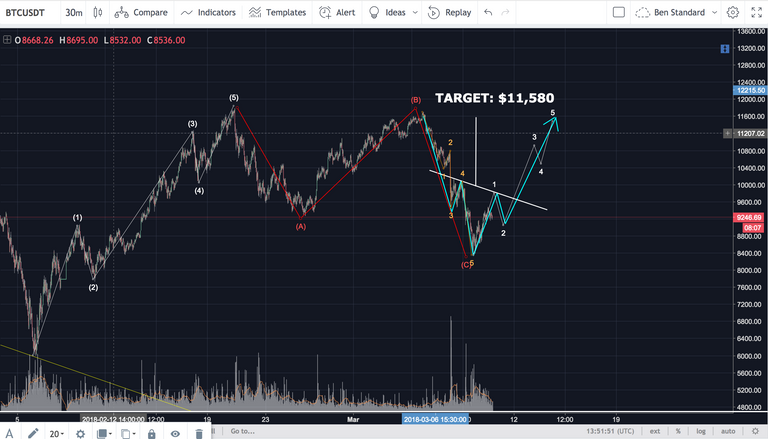
Moving forward, there are indications pointing that we've hit the "bottom" for now, at around $8,300 and that we've started a new set of impulse waves. The big inverted head & shoulders pattern have completed (or almost) and we can expect a bull run now given that we don't lose too much volume and momentum.
New Potential Head & Shoulders pattern
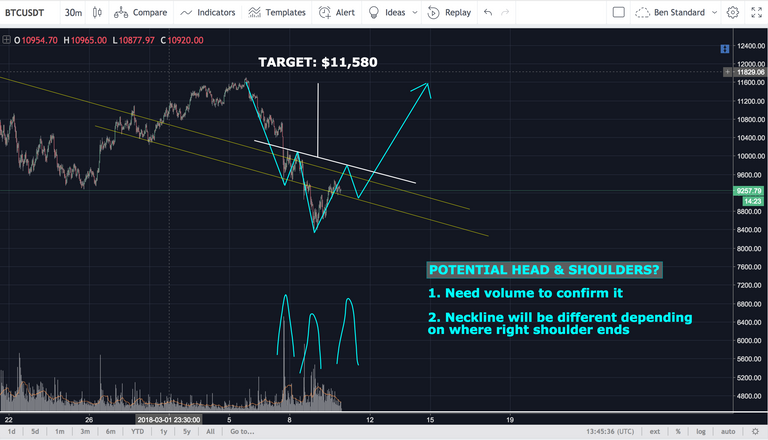
When viewing the charts, I spotted a new potential head & shoulders pattern that could make sense when adding it to my current Elliot Wave count.
We can extrapolate a new price target by measuring the depth of the pattern from the neckline to the bottom (or top) of the head Then simply take the measure stick and place it on top of the neckline. That will give us a price target at $11,580.
A coincidence? No, there's a lot of resistance there so I wouldn't be surprised if we correct after hitting this target. My strategy is to take profits (sell some of my BTC) a little before these resistance zones. That way I can make sure to not get punished if price drops again. Also, If I see that we pass the resistance with volume and decisivness I can buy back some with the confidence that the previous resistance zone probably will act as a future support zone. Does that make sense? Please comment if you want me to elaborate more on this.

This is how the subwaves could look like to fit in this new head & shoulders pattern forming:

The Big Picture
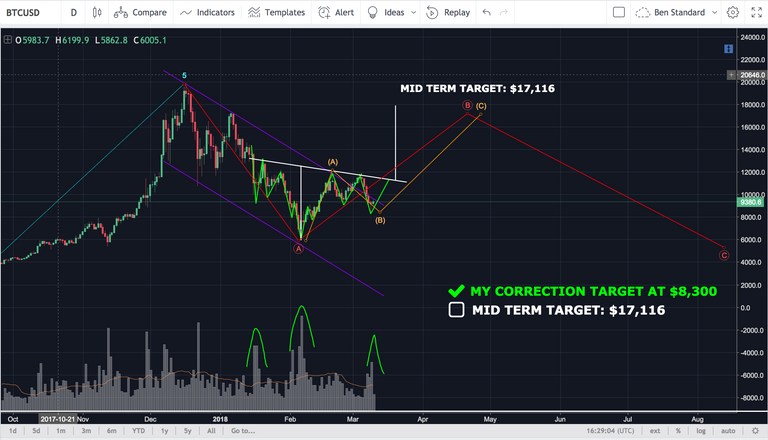
Let's move on to the most important part of this analysis. Now that we've completed the big head & shoulders pattern we can extrapolate a price target of that trend reversal. If we use the same method as before, simply by measuring the depth from the neckline to the head, we will have a new price target that fits very well with my overall prediction on the BTC price.
🤑 Mid term target: $17,116
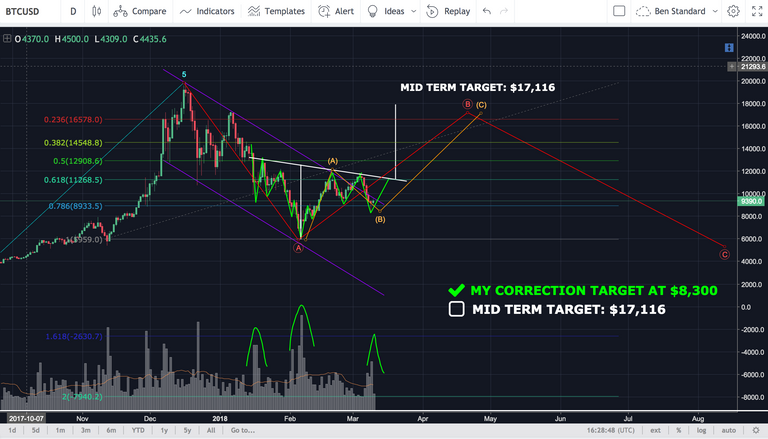
Keep in mind that this is just a projection based on the current data we have right now. This analysis could (and will) probably change as we get closer. The new Elliot Wave count is based on the height of the current 1st impulse wave along with other guidelines from the Elliot Waves Principles.

Out of curiosity, I placed a Fibonacci retracement diagram based on the previous correction wave (A). And it's amazing to see how well it fits into my count. Watch how all dips and highs sits perfectly at each level.

I know many of you Elliottitians will claim that my grand ABC count is too big and perhaps too long but I will not focus too much on time perspectives at this moment. My main focus is to set the targets right and I believe that everything else will fall into place as we move forward. If we reach new all time highs above $20,000 then I would invalidate the ABC and probably predict that we're in the 5th and final wave at a grand perspective.
Follow me on Twitter and turn on notifications to get instant updates at http://www.twitter.com/benkalashnikov
Disclaimer:
I'm not a financial advisor and these are only my opinions. I don't take any responsibility for any investments that you make based on my analysis.
I learn so many techniques from your posts!
Great to hear that!
You got a 8.31% upvote from @postpromoter courtesy of @benkalashnikov!
Want to promote your posts too? Check out the Steem Bot Tracker websitevote for @yabapmatt for witness! for more info. If you would like to support the development of @postpromoter and the bot tracker please
Thanks you for this information!
Can you make articles for beginner because we know nothing about this topic

Thanks for the analysis. The investors would be greatly helpful
Thanks for the analysis, especially the big picture.
Hi @benkalashnikov . I think it could be like hourly chart below and 9500 is important resistance. If price over this level, bullish trendline can continue on its own path.
It will go upto 9750$ easily
Yeah, we don't have enough volume to break through now :(
Thanks very much for the analysis. I want to be kept updated, do you also have a twitter account?
It is at the bottom of the post
Sorry I don't know how i missed that
Really like your analysis. Straight forward and easy to understand. Thank you.
Thanks!
Hi Benkalashnikov. Have asked a few others this question. I see you trade Bitcoin and Etherium and obviously doing rather well. I am planning on going the same route. Last year with Bitcoin how many decent opportunities was there trading on the up waves. Doesn't have to be exact but just a ball park figure.
hello, I have no idea about how Elliot wave moves but i am still interested in your studies..seeing your chart seem really a good way of learning. My Philippine peso keeps on lowering down because it was in bitcoin. I earned it from my steem it activity ang I hope that soon it become high. can we predict about it?
Make sure to join the Benkalashnikov Fund at www.benkalashnikov.com and start upvoting my posts and you'll get a chance to earn money for free if the fund does well. No strings attached :)
ok that's a good post but i can clearly see that btc is going down at $6k within few days.
Possible, but I think it's more likely that it'll go up before that
All the best to you guys 😎
We agree with you @benkalashnikov on the short-term but be carefull past 11800$ area ! https://steemit.com/bitcoin/@tatchcapital/tatch-trading-journal-btc-quick-bucks-on-bitcoin-before-next-smash-counter-trend-move
Good info! Thanks
ACTIVITY MONITORING REPORT
Receive reports on your customer's blockchain activity to improve alerts and issues in quarterly review meetings. We break down blockchain activity with different categories so you can assess the risks of doing business with each of your on-board customers.SUCCESSFULLY PERFORMED TEST TOOLS
Have a warning triggered on one of your blockchain clients? Or want to investigate something before doing quarterly? Chainalysis has an enhanced due diligence tool that allows you to visualize the source and destination of funds.@benkalashnikov