Hi, this is my first public analysis on Bitcoin.
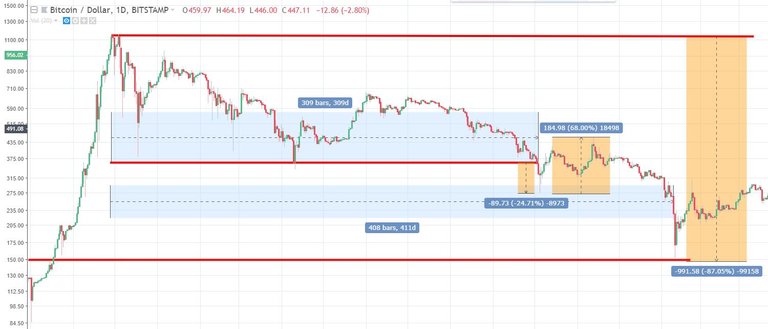
BTC/USD Chart 2013-2014
If we look at the BTC Chart 2013/2014 we can see that the previous low/bottom hold for around 310 days.
Then after 310 days BTC dropped by another 25%.
Once BTC broke this previous low he went up about 70%, only to hit his bottom @-87% after 410 days from previous ATH.
This bottom was followed by BTCs rally for 2 years until december 2017 with hitting 20K$.
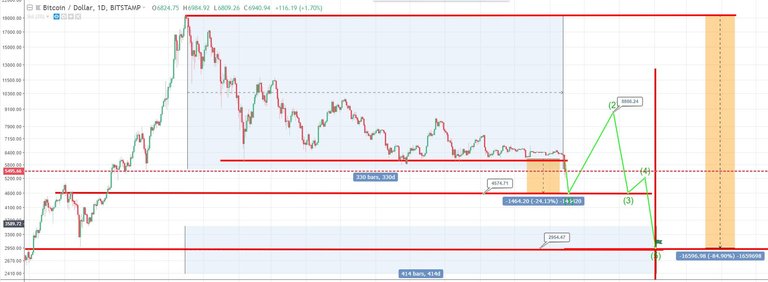
BTC/USD Chart 2017-2019
If we compare this to the current market situation, we can see BTC now broke his previous low of 5800$ after 330 days.
Compared to 2013/2014 this would mean BTC is dropping by around 25% to 4500$ now and could get up 70% after this to around 8800$ until end of 2018/start of 2019. Maybe Bakkt could get BTC up to this.
In mid-february 2019 BTC would hit his real low of the current bear market cyclem, after 410 days from previous ATH (compared to 2014).
If it's the same as 2013/2014 it is around -85% from previous ATH, this means 3000$.
After hitting 3K$ the new bull market cycle starts, maybe triggered by VanEck's ETF approved by SEC wich is End of feb. 2019 too.
This bull market could last until end 2021 with a new ATH, compared to 2014-2017.


Congratulations @autobach! You received a personal award!
You can view your badges on your Steem Board and compare to others on the Steem Ranking
Vote for @Steemitboard as a witness to get one more award and increased upvotes!