The whiplash “to da moon” rocket launch coming out of this current bear trap flash crash (which will probably bottom $6350) might break the necks of Tone Vays and goldbug Peter Schiff. Tone Vays is our perennial Chicken Little at the bottoms for Bitcoin.
Peter Schiff is now repeating his sub-$1000 doomsday prediction that failed at the prior $3.1k bottom:
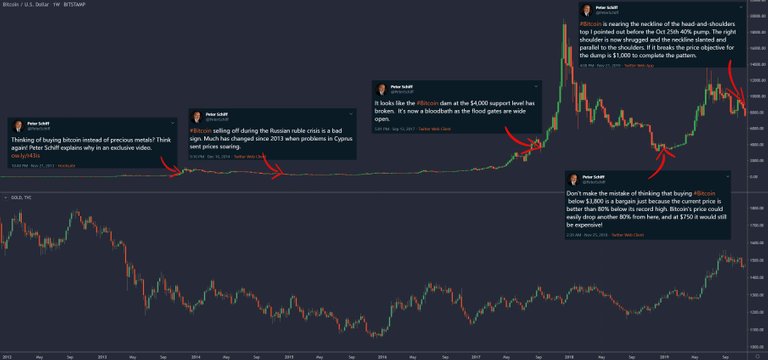
History of Peter Schiff’s incorrect Bitcoin predictions
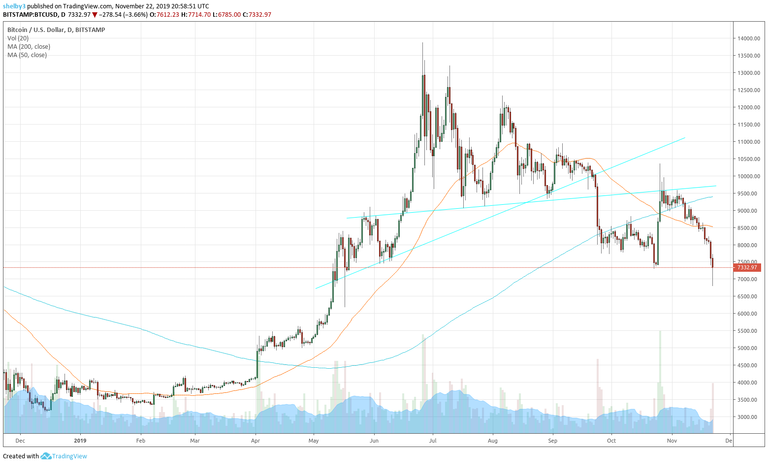
Peter Schiff has identified what he believes is a bearish head-and-shoulders (H&S) pattern:
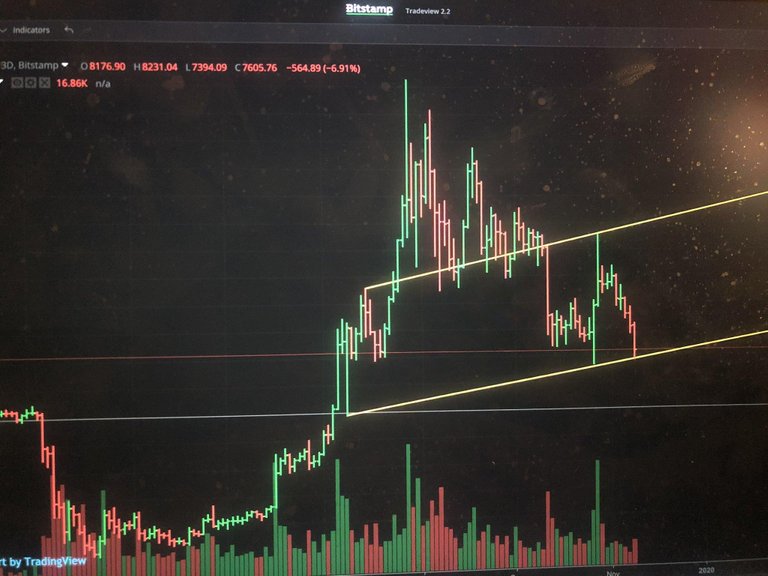
There’s no well defined left shoulder, except the one charted below that targeted a decline from a neckline of $10,000 down to between $4.3k to $5.2k but with the average decline only 16% of the target and only 51% reaching the target so a higher target such as $6.35k is also possible:
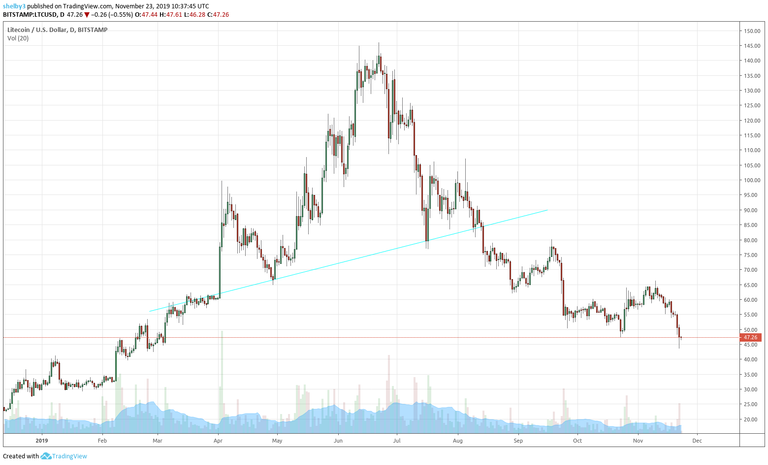
Litecoin’s analogous bearish H&S pattern was projecting to between $13 to $18 but this violates the rule that “Price must have something to reverse, so if the rise leading to the pattern is small, expect a small decline,” thus entering the H&S pattern from $61 after a rise from the bottom of $22, indicates a bottom in the range of $30 to $40 is likely:
Bitcoin to $1000 is a delusional fantasy that would require that millions of worldwide adopters who think Bitcoin has a very important future and present use case (even if they believe in the incorrect Bitcoin future, c.f. also), suddenly no longer think so. It would require that the Herculean tangible mass of Bitcoin and the $billions in mining costs expended since January 2009 would suddenly “go poof” and disappear, because they can’t be re-purposed to anything else. Bitcoin is just as tangible as gold, yet additionally has the incredibly important increase in utility because the transferable value is information and detached from the tangible mass.
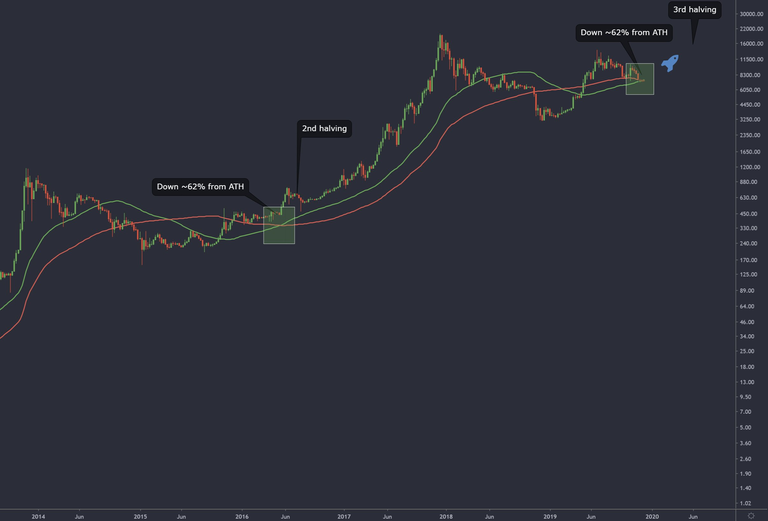
Filb Filb noted the likelihood that the bearishness, of the 50 DMA bearish crossover of the 200 DMA which occurred in late October, would be short-lived due to the imminent bullish 50 WMA crossover up over the 100 WMA at the end of November:

(curved line is straight on the linear scaled price chart)
The last time the 50 WMA crossed up over the 100 WMA was May 2016 and the Bitcoin price rose 80% in one month:
The 100 DMA recently crossed under the 200 DMA which was bearish in 2018, but it’s at a high price above $9000 (providing plenty of overhead space for an extended rally which could turn the 50 and 100 DMA upwards again) and the 50 WMA was not crossing up over the 100 WMA in 2018:
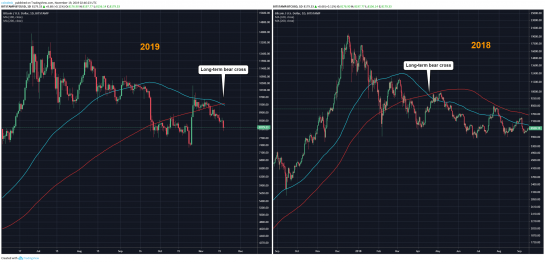
Note 50 weeks is 350 days so is a much larger inertia that will overwhelm the 50, 100, and 200 DMAs, although the latter can and is dominating short-term.
Interestingly note that for Litecoin the 50 and 100 DMA crossed under the 200 DMA some 3 and 2 months ago respectively (thus in theory their bearish impacts more depleted and already played out), yet the 50 WMA will not cross up over the 100 WMA until roughly the start of January although Litecoin’s 50 WMA is high at $70 compared to $7100 for Bitcoin. This may portend an altcoin season in December and/or January wherein altcoins have greater rallies than the rally of Bitcoin, as was the case from February to April coming out of the prior $3k bottom.
Remember at the $3.1k bottom Tone Vays was predicting $1300 from December through April. Right on cue, Tone Vays embraces the marginal miner “hashrate ribbon” capitulation theory and thus is now predicting a ~50% drop from the ~$8500 cliff edge to $4500 because he and Willy Woo are comparing to the -50% drop from $6.2k to $3.1k at the end of 2018. But the “hashrate ribbon” capitulation has not made any headway (c.f. hashrate chart) while the precipitous Bitcoin price decline has proceeded. There’s another way to proportionally compare that prior case to the current one. The proportional decline of $3.1k divided by the total rise from $150 to $19666, compared to this ~$2.1k decline divided by the total rise from $3.1k to $13.9k.
Willy Woo is overreacting to the “hashrate ribbon” capitulation and predicting bearishness all the way to the halving:
On Monday, statistician Willy Woo forecast that current Bitcoin price behavior would remain “unique” compared to previous cycles in its history. Specifically, BTC/USD would approach its 2020 block reward halving on bearish sentiment. In 2012 and 2016, halvings followed at least six months of bullish progress.
@masterluc who had several major correct predictions including I think the $19.7k ATH, also subsequently predicted the decline to the $3.1k bottom, the subsequent rise to ~$13k and a decline to ~$6k for the final bottom at end of November or early December.
After predicting the prior $3.1k bottom (and the $19.7k ATH ) by speculating that was the miners’ marginal cost of production which they would defend as a ‘line in the sand’, Filb Filb has been predicting since July that ~$6350 which is double that prior bottom, would be the bottom of this correction as we approach the halving event which will halve the block reward thus doubling miners’ cost of production. Filb Filb reiterated recently:
https://cointelegraph.com/news/bitcoin-price-loses-8-000-support-as-bears-drive-market-to-4-week-low
Continuing the forecast, fellow contributor filbfilb highlighted even lower levels —
$6,500or the pivotal profitability price for miners — as the ultimate floor if bearish sentiment continued. Before that, the 100-week moving average (WMA) at$7,520could provide further support.As Cointelegraph reported,
$6,500is considered by many commentators as the lowest possible Bitcoin price under current conditions.“Still think the 100 WMA will hold up at this stage, but if it doesn’t, I’m all in at
$6,500,” filbfilb said in private comments.
https://cointelegraph.com/news/bitcoin-miners-will-defend-price-above-6-500-ahead-of-halving-analyst
Are miner’s controlling the market?
That was the conclusion of a new Bitcoin price analysis by popular trader Filb Filb as BTC/USD neared$9,000on July 17.
“I was saying all the time in the bear market about these 12.5 BTC orders,” he says, “They disappeared in the bull market this year and came back at 13K.”
Filb Filb theorizes that the miners may have been contracting their selling pre-halving to create new a halving bubble, which would present a supply shortage and the opportunity to maximize their realizable revenue per unit. They will then defend the new cost of production or double that of the previous at the
$6,500Bitcoin price level.
Filb Filb is probably correct that the miners defended $3.17k before as their cost of production. And they will defend $6.35k this time because their cost of production will be doubled at the halving of the mining reward as of May 2020. The miners were hedging forward (i.e. selling) all their production from July peak to this November/December bottom, because they wanted to buy as much mining equipment as cheaply as possible. At $6.35k, they will withdraw all selling and hodl to create a long squeeze to drive another huge ATH bubble in the price before the May 14, 2020 halving.
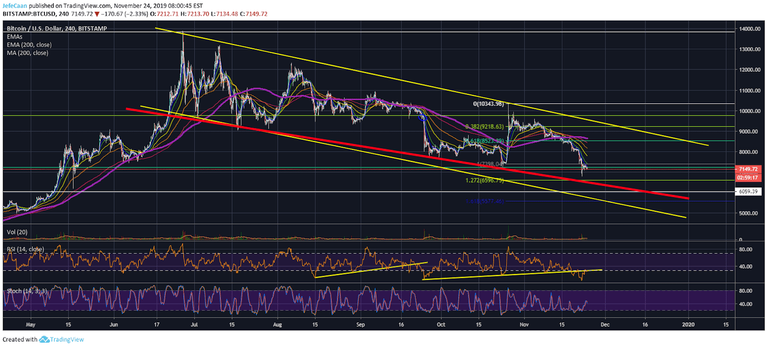
If in some highly unlikely event Bitcoin flash crashed below $6k, I expect this would only be a very brief overshoot of miners’ defense of production costs. For example, here follows a scenario for a $5880 spike bottom low:
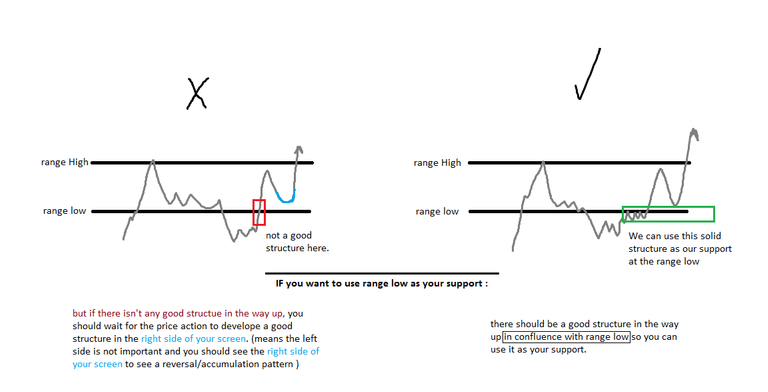
(click to zoom)
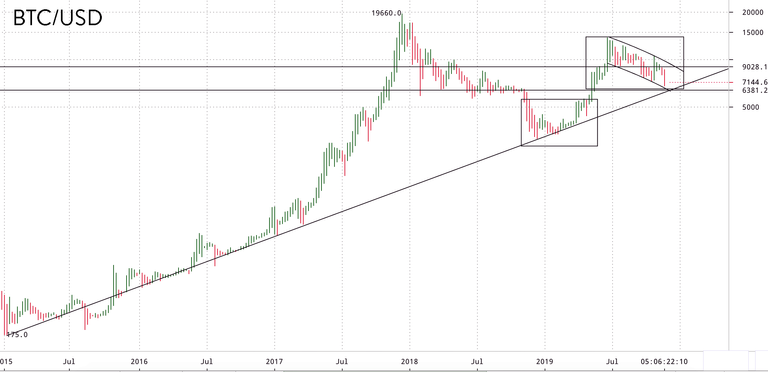
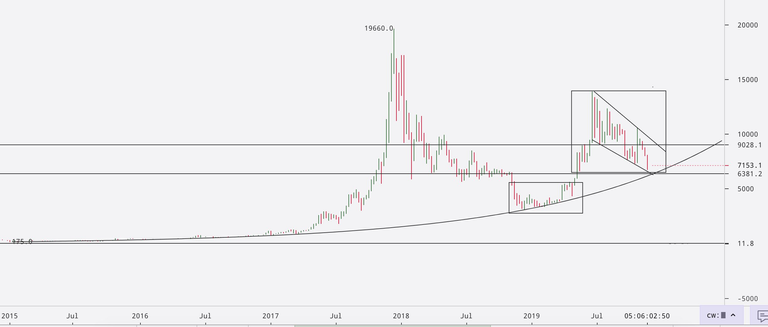
I annotated an alternative interpretation to a bearish chart in the Internet article Can Bitcoin (BTC) Decline Straight To $6,000 And Lower?:
(click to zoom)
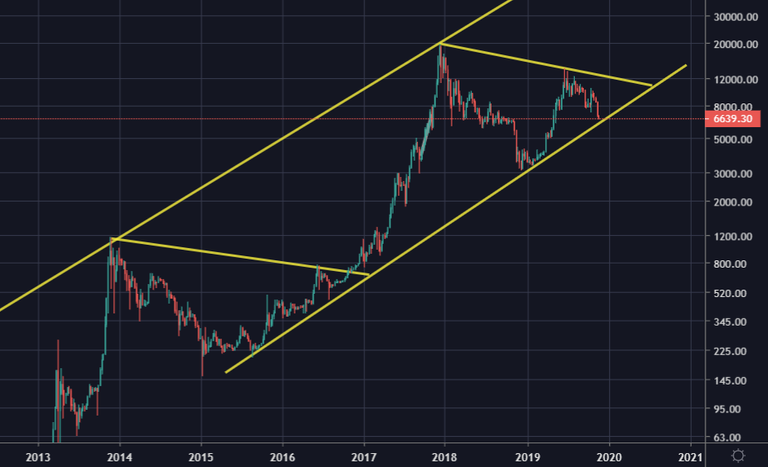
Tuur Demester also noted this on Twitter:
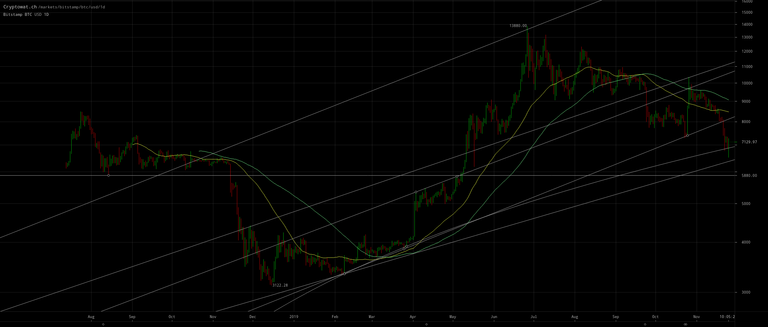
Bitcoin's parabolic uptrend which started in January 2015 is still intact. Now nearly touching support again, for the first time since March 2019. #buythedip
it's a logarithmic scale:
I also refuted the more extreme bearish predictions in a comment on my prior blog:
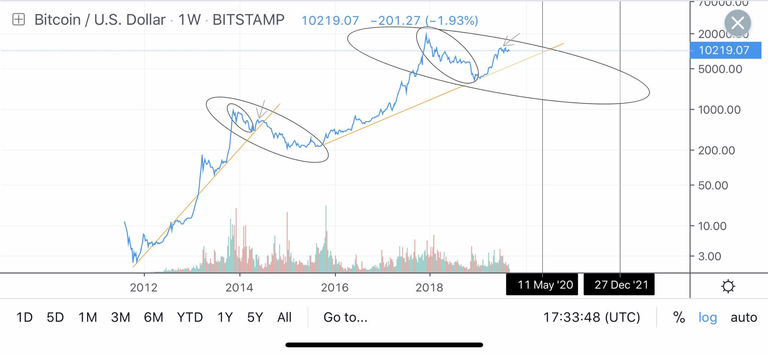
Note though there is a speculation (c.f. also) by Willy-Woo that Bitcoin could crash. Here’s the most extreme idea for a crash to
$1000:They’re warning about “hashrate ribbon” capitulation. If true, this could bring the price down somewhere between mid-
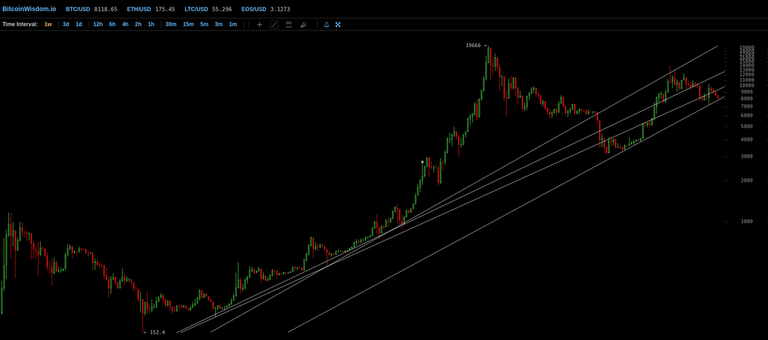
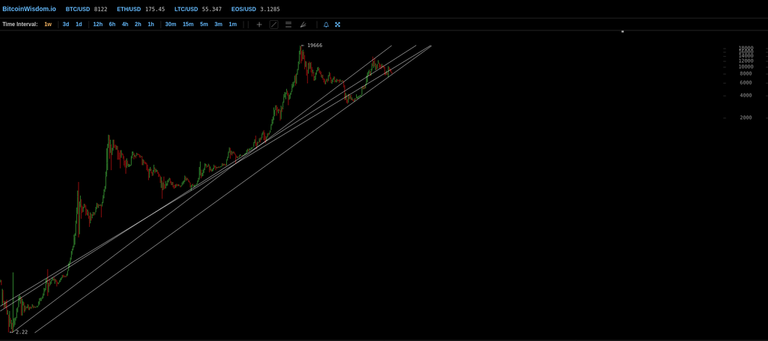
$6000s to low-$7000s. Which would be consistent with @masterlucs’s long-standing prediction of a decline into the$6000s by early December.That extreme idea depicted in the chart above is incongruent with the topological interpretation I posited in this blog of mine. His idea makes no sense because he is presuming topological equivalence between a -30% decline to a -85% decline (at the neckline lows to the left of each of his arrows)! Instead the decline is at most back down to Hairmaclairy’s support line and then upwards for a second much higher ATH than the one in late 2017:
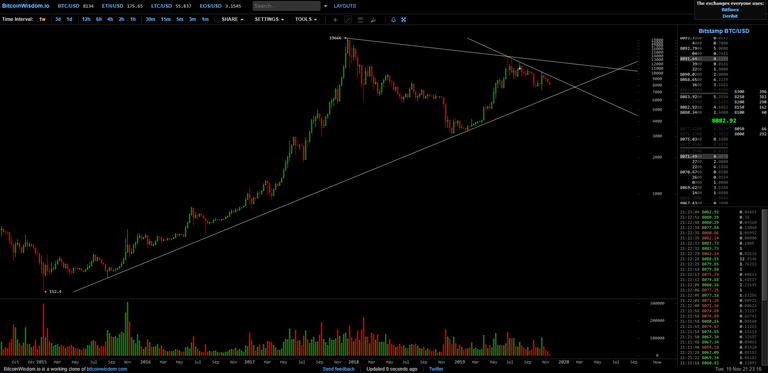
Here were my charts in response to Hairymaclairy’s:
Maximum fear, pessimism, and doubt is what we want to see at the bottom, especially when the impetus is disinformation, propaganda and FUD. China’s suspiciously timed threat today to ‘dispose of’ all domestic crypto exchanges is humorous given they had long ago already banned crypto exchanges, so presumably there aren’t any of significance they can realistically dispose of. The fake news about Binance being raided is also suspicious.
Decentralized exchanges which can never be banned, are receiving intensive development, c.f. also, also and also.

@tipu curate
Upvoted 👌 (Mana: 10/20 - need recharge?)