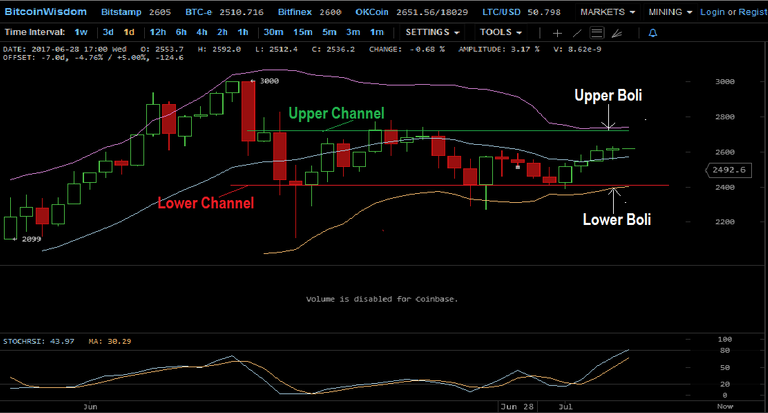
When I first got into trading I was exposed to so many technical indicators I had no idea where to begin reading the chart. The Indicator called the Bollinger Bands has been a good tool to see where the current trend of a stock or Bitcoin is in.

The Bollinger Band or what I just call the "Boli" works on the volatility of a stock in a band that is above and below the moving average. What this does is give you a visual parameter of which the current price of a stock on the upper end and the lower end. We can see that currently BTC is sitting in the middle of this boli band on the chart. What this tells me is that the movement of BTC is in a steady move and appears to be some consolidation happening. No explosive moves up or down but steady growth the last few days.
The upper boli is sitting at the 2730 which were resistance points June 12, 13, 19, 20 22, 23 and 24. The price never finished above that point showing that BTC did not have enough steam, pun not intended, to test and break through that point. The lower boli shows us that it is riding around the 2400 mark. This was support for several days previously June 14, 15 25, 26 and July 1. The channel that has been established is within these points of 2730 and 2400. It tested these two significant areas without success to either breakout above the current trend or below. Which is a good thing.
What would be nice to see is some accumulation build up to breakout above the 2730 mark sending the price to test the next level of resistance which I believe is around the 2800 mark which was tested a few weeks back but did not breakout. I am sure it will breakout very soon.
Keep an eye on the Stochastics as well. It looks like it is about to top out. This does not mean it will cause a pullback but it might send some selling and taking profits. This could be a bad thing because Mr. Emotions will see a small sell of and panic himself to sell causing panic among other Emotional traders to follow suit. It is what it is and if that happens then it is opportunity for us to obtain more at lower prices. Buy on the dips. When the price jumps the Mr. Emotion will have to buy back in at a higher price causing him to ask the age old question, what just happened?
Again, I am not an advisor, just saying what I see in the BTC chart. I hope this comes as some help to you. I know I needed all the help when I started and could not find anyone to give a hand. But then again it was in the stock market. This market seems to have much more nicer people.
All the BEST!