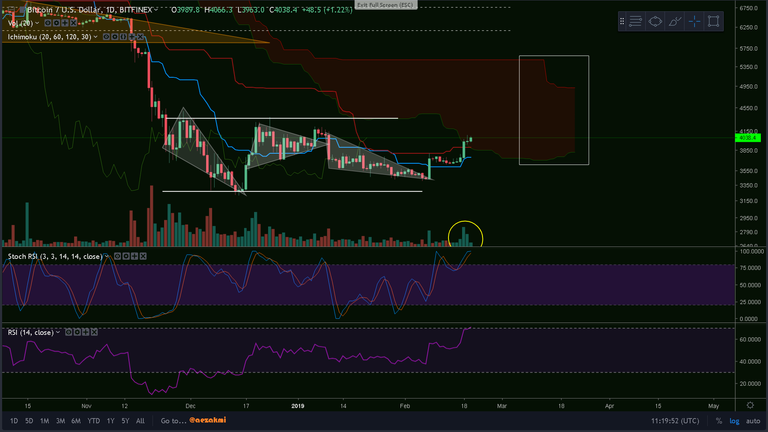
Bitcoin daily
Bitcoin is currently crossing the red Ichimoku cloud (or at least trying to), which majorly reduced its thickness with the last price spikes. Also, the trading volume increased significantly in the last couple days. However, the Stoch RSI indicates that BTC is currently overbought and the RSI hovers at the 70 mark, a level that we've last seen in July 2018 - so a correction in BTC's price could happen any time and shouldn't be excluded.
Ctrl + Click here to enlarge the image in a new tab (steemitimages)
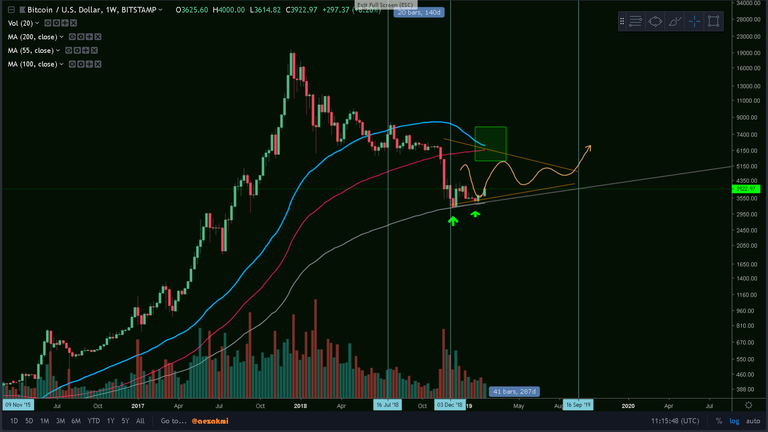
Bitcoin 2014 comparison chart
See here the original post from 3 months back!
For those following my posts, you know that from time to time I post the comparison of the current market situation with the one from 2014. At the moment we are going as expected: we're still bouncing off the 200 week MA (grey). Be aware that around mid March the 55 MA (blue) will meet the 100w MA (red) - marked by the green square. This incident will give us a glance about the future price action.
Ctrl + Click here to enlarge the image in a new tab (steemitimages)
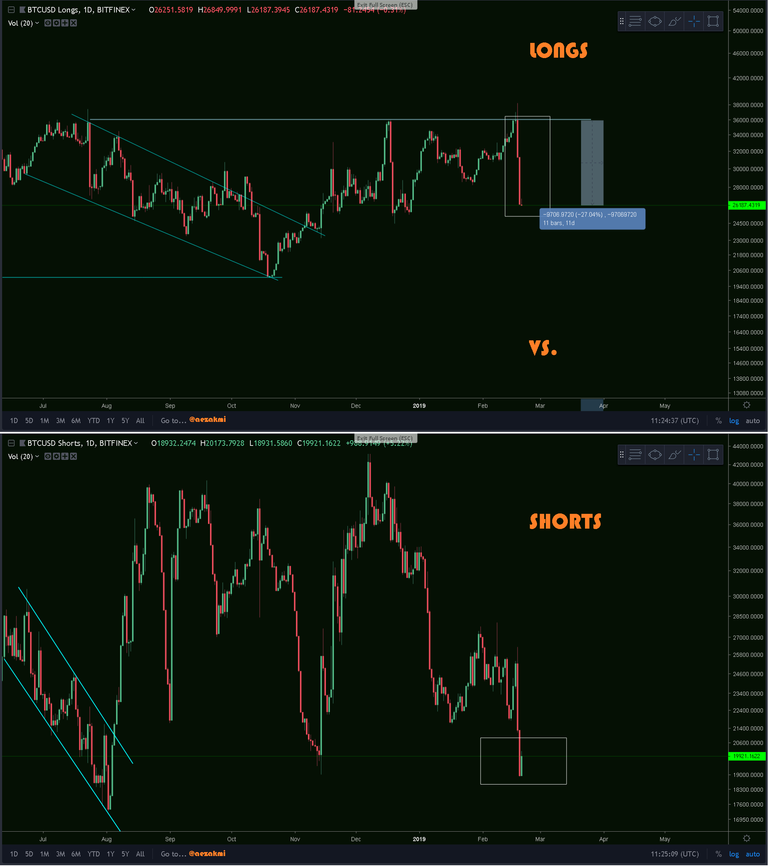
Longs VS Shorts
Beware that many BTC longs are being closed these days and shorts are starting to rise. This might be people who have insights about the next move in the market. According to what's going on here I might say that people are preparing for a correction.
Ctrl + Click here to enlarge the image in a new tab (steemitimages)

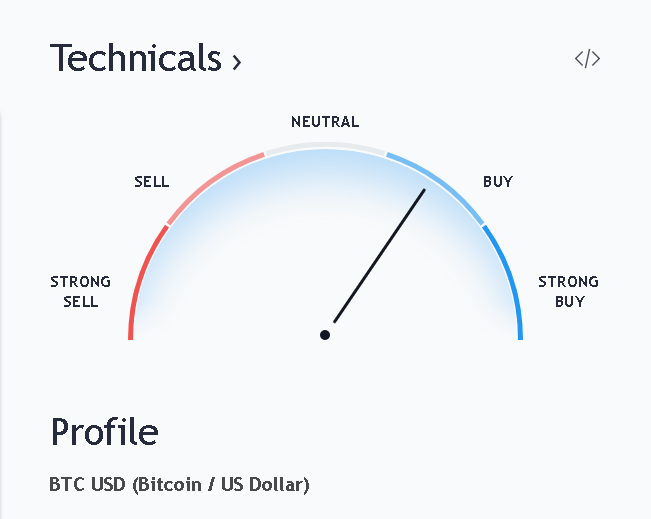
Market sentiment
The current market sentiment on Tradingview:
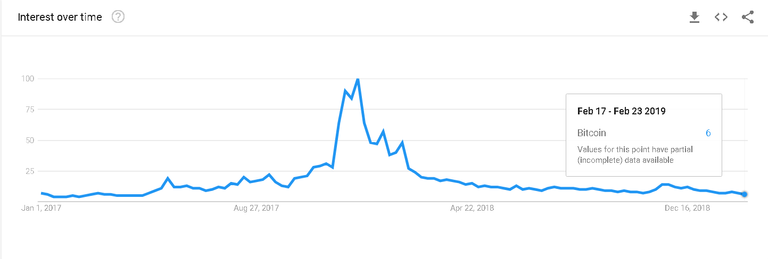
Interest in Bitcoin
The global interest in Bitcoin (according to the Google Trends) is getting lower and lower. We're at the lowest in almost 3 years.
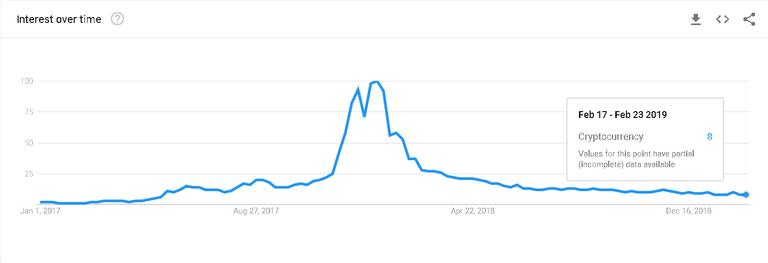
Interest in Cryptocurrency
Almost the same as Bitcoin


These are some of the exchanges I use:
Any amount is highly appreciated!
- Bitfinex - my most used exchange
- Binance - most popular exchange
- Kucoin - excellent exchange, rising in popularity
- Gate - for small cap / new coins
- Huobi - margin trading
- Coinexchange - big variety of coins
- Magic Dice - Feeling lucky? Gamble your money
- Freebitco.in - earn free Bitcoin & high prices - if you're lucky
- 0xe1347a6F7f44fdd6Ae8B2fA80E1c8e1e4a13C7a5 - If you wish to donate ETH / or ERC-20 tokens
- 19feKUFZ4XgYbFLQf4MA3B8RnmF5s98m53 - If you wish to donate BTC
Thank you!
Find me on Twitter updates
TIP: ALWAYS CREATE A DIFFERENT PASSWORD FOR EACH EXCHANGE!NEVER HAVE THE SAME PASSWORD TWICE!SAVE THE PAGES TO YOUR BOOKMARKS, SO THAT YOU WON'T CLICK ON SCAM SITES! MANY GOT FOOLED AND LOST A LOT OF MONEY!
Thanks for reading and safe trading!✌
If you find this post useful, please:

Interesting to add the 2014 comparision. Interesting years ahead
Posted using Partiko Android
Yes, indeed. And what's more interesting is that until now we respect it.
Stochastic RSI on weekly, is on highest point now since start of bearmarket. Can it get much higher?
I believe it can. Especially that the RSI on the weekly is just taking off (currently at the 40 mark). The Stoch RSI is more of a momentum indicator and for now there seems to be no major change in Bitcoin's momentum. On the monthly, the Stochastic indicates a bullish cross for the first time since the correction started. And the momentum usually changes direction before the price does, so this might be a 'new beginning'.