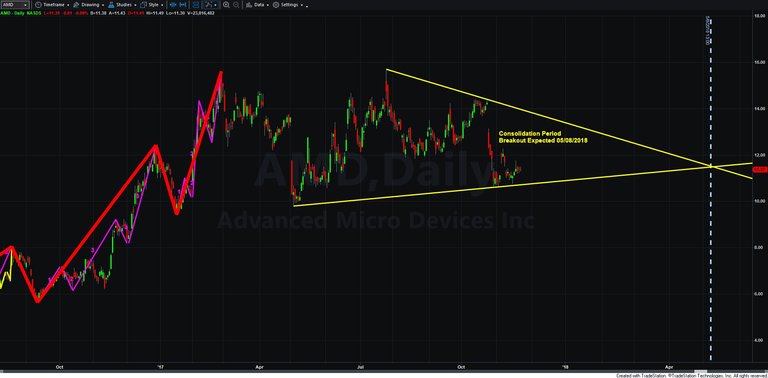
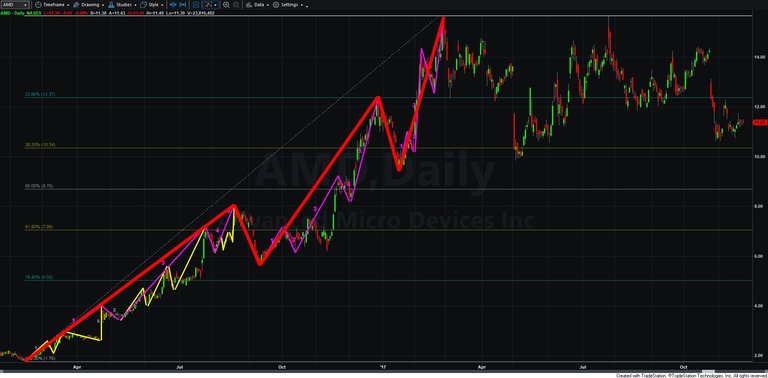
TLDR: This is my first application of the Elliot Wave Principles and Fibonacci Retracement/Extensions. I analyzed Advanced Micro Devices (AMD) to see where it might end up over the next 6 months.
I am very confident in my analysis of waves 1 - 5 during the price increase from $2-$15, but I am less certain about what has happened to the stock after that. My eventual conclusion is that it must be in a prolonged consolidation period. I extended two trend lines out following higher lows and lower highs and they crossed in early May of 2018. If this consolidation period holds on those support lines that is a very bullish indicator to me because it did not retrace very heavily. If this holds there is a very strong possibility that there will be a price target of $24 dollars. Because stocks are less volatile than Crypto I don't expect that price for a long time, but I will be interested to see if my plotted support lines hold for AMD and a breakout happens during Q1 of 2018.
This is my first analysis using Elliot Wave Principles so please give me feedback!
Looking forward to posting many more charts on here for you guys.


Thanks for your good posts, I followed you!
Congratulations @xanatos! You received a personal award!
Click here to view your Board of Honor
Do not miss the last post from @steemitboard:
Congratulations @xanatos! You received a personal award!
You can view your badges on your Steem Board and compare to others on the Steem Ranking
Vote for @Steemitboard as a witness to get one more award and increased upvotes!