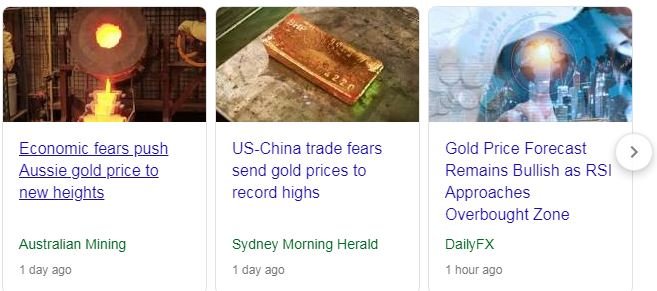
Markets are in flip flop mode. Safe haven demand gets more attention with gold hitting levels not seen since 2013. No surprise that my trade action is in gold mining (taking profits and improving trade structures).

Portfolio News
Market Flip Flop
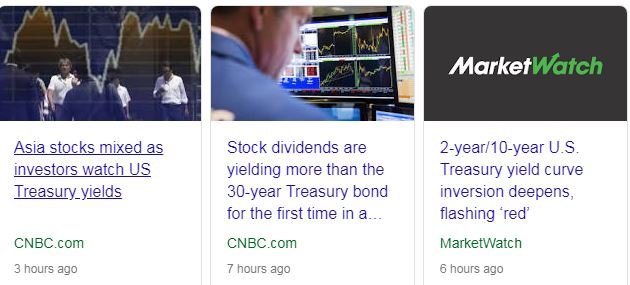
Market flip flop continues as investors worry whether China did or did not make those calls.
US markets opened in positive territory (believing China did call) but closed the day down on fears about the curve inversion.
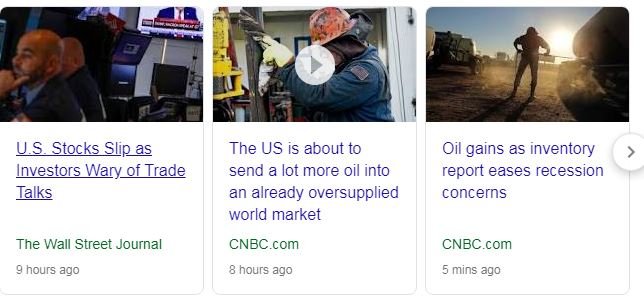
The flip flop nature is clear in the headlines on oil - an oversupplied market versus declining inventory levels. Only one of them can be right or a lot changes in the space of 8 hours.
Gold price continues to move ahead dragging gold miners with it.
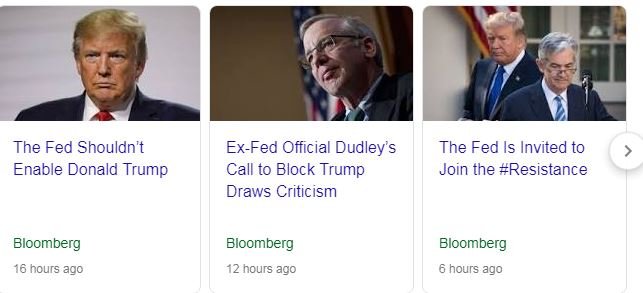
Maybe the biggest news of the day was the attack by former Federal Reserve Governor, Bill Dudley, suggesting that the Fed should not enable the Trump trade policies - i.e., not apply a bailout if it is needed. Mind you this was on a day when Trump went Fed bashing again with a strong US Dollar on his mind.
https://www.businessinsider.com.au/trump-bill-dudley-says-fed-shouldnt-enable-trade-wars-2019-8
Bought
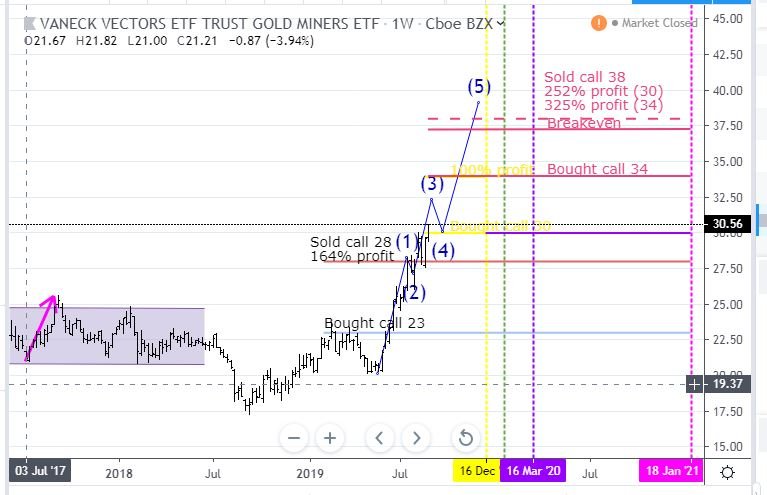
VanEck Vectors Gold Miners ETF (GDX): Reviewed the open ended December 2021 call options I bought yesterday and decided to convert them into bull call spreads by selling January 2021 strike 38 call options. This leaves me with two trade structures for January 2021 expiry
- 30/38 bull call spread with average net premium of $2.27 which offers maximum profit potential of 252% if price moves 28% from $29.64 opening price before January 2021. Price moved the first 3% of that during the day and trade is in-the-money.
- 34/38 bull call spread with average net premium of $0.94 which offers maximum profit potential of 325% . Price does need to move 15% to get to in-the-money status
I remain exposed to a January 2021 23/28 bull call spread in one portfolio which has passed maximum potential. I will close that overnight.
I have updated the chart - it is messy as I have quite a few trades open. I have added in the new sold call (38) as a dotted pink ray. I have annotated the maximum profit potentials for the two spreads (30 and 34)
The key part of the trade is it places the maximum profit potential line only a little higher than the prior breakeven level for the 34 strike bought call with an appreciable jump in profit potential. It is still very much a blue sky trade but a lot more economic than it was. One could improve the profile further by selling a put (maybe with a shorter expiry) below the last consolidation (say $27). I will not do this as a change in the China trade situation will see that level tested in a heartbeat.
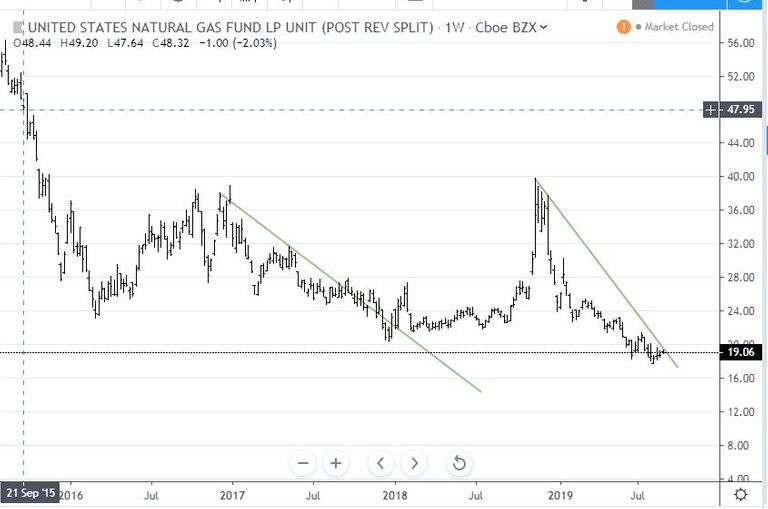
United States Natural Gas (UNG): US Natural Gas. Rounded up holdings to 100 shares to be able to write covered calls. Chart looks like it might have found a bottom though it has not broken the downtrend line.
Note the seasonality in the chart.
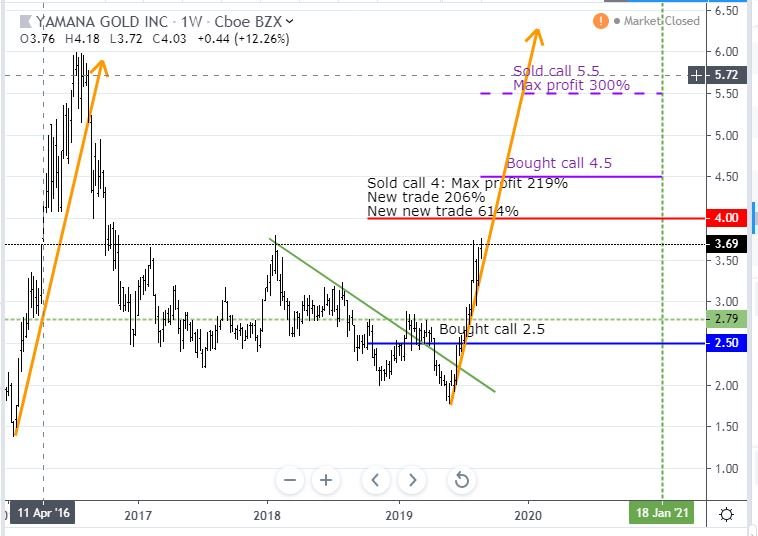
Yamana Gold Inc (AUY): Gold Mining. Reviewed January 2021 strike 4.5 call options I bought yesterday and decided to reduce the net premium. I made two trades selling a September 4.5 call option and also selling a January 2021 5.5 call option. This brought the net premium down from $0.75 to $0.25. This then offers maximum profit potential of 300% if price moves 49% from $3.69 closing price before January 2021. Price does need to stay below $4.50 between now and September expiry.
Quick update of the chart which shows the new sold call (5.5) as a dotted purple ray. I have not shown the short term sold call as it is at same strike as the bought call (4.5).
The sold call level is the highest strike that was listed. That works for me as it is below the 2016 highs which coincided with the flash crash in 2016. The level is also lower than the prior 100% profit level of the open ended trade with a considerably higher profit percentage.
Sold
VanEck Vectors Gold Miners ETF (GDX): Closed out October 2019 strike 26 call options for 246% profit since June 2019. In one portfolio I am holding October sold puts (strike 24) which were set up to fix a trading error (it is currently working just fine)
Lam Research Corporation (LRCX): Semiconductors. Jim Cramer chose to take profits in the Action Plus portfolio. His thinking is to take profits on up days and buy back on dips. I reduced my holding by half for 7% blended profit since June/August 2019
Shorts
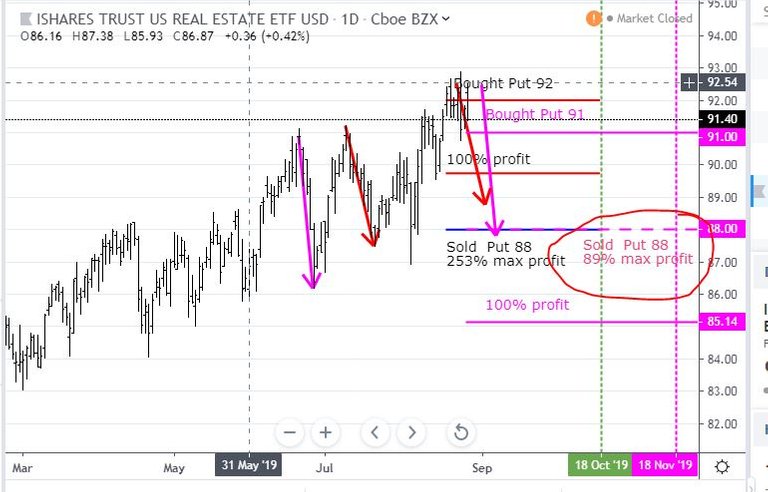
iShares U.S. Real Estate ETF (IYR): US Real Estate. I reviewed the November 2019 91 strike put option I bought the day before and decided to convert the trade to a bear put spread. Sold November 2019 strike 88 put option to achieve a net premium of $1.58 which offers 89% maximum profit potential for a 3.9% drop in price from closing price of $91.40.
The updated chart shows the new trade as a dotted pink ray. The level is more comfortable BUT not as good a trade structure as the one set up last time in my other portfolio (the red rays). At least the maximum profit can be reached with a pink arrow price scenario
Income Trades
2 new covered calls written on Intel (INTC) and TJX Cos (TJX) for an average premium of 0.27% with coverage of 9.77%. Pretty comfortable that neither of these stocks will move that far in 23 days.
Cryptocurency
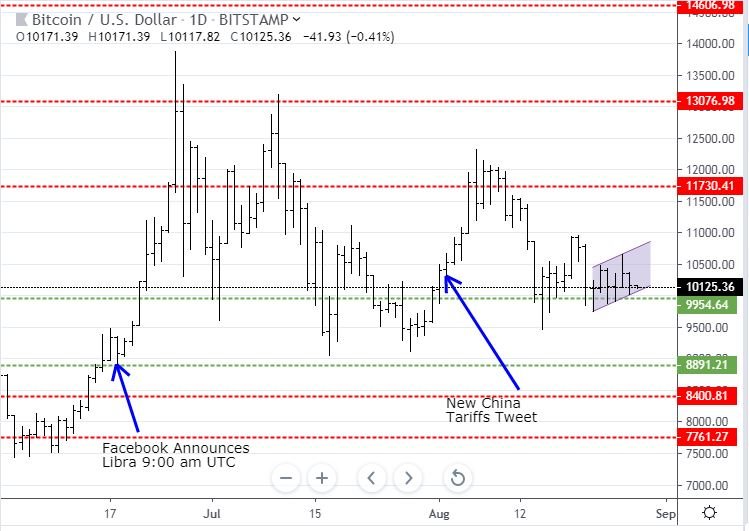
Bitcoin (BTCUSD): Price range for the day was $356 (3.4% of the high). Price pulled back and tested down to the buyers around the $10,000 level. Pattern is beginning to look like a pennant
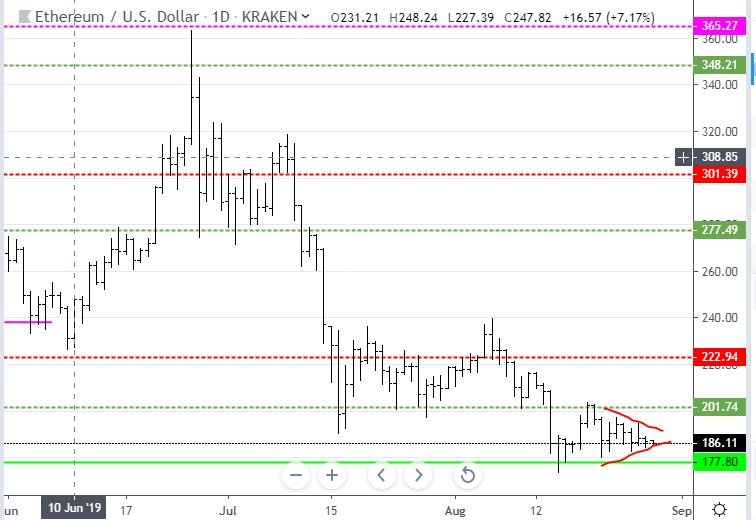
Ethereum (ETHUSD): Price range for the day was $5 (2.6% of the high). Price continues to drift lower in "no mans land" making something of a triangle. I did say yesterday it was hard to say where price would go - nowhere was the answer.
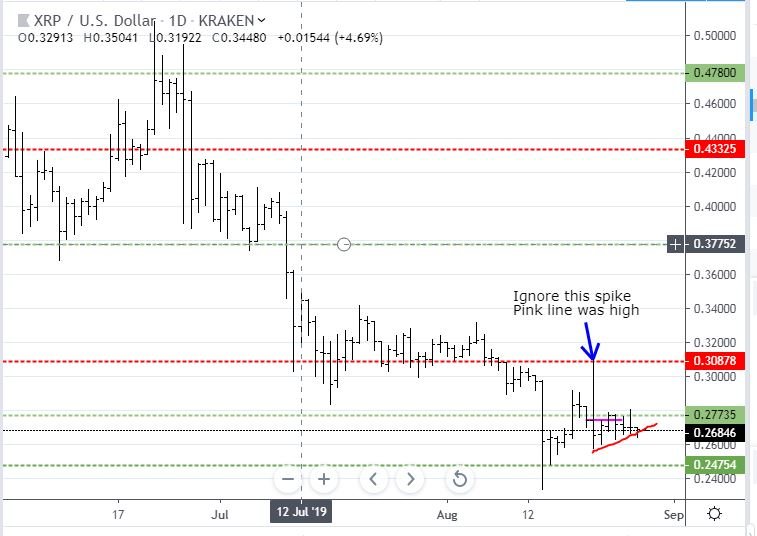
Ripple (XRPUSD): Price range for the day was $0.00617 (2.3% of the high). Price drifted a little lower breaking below the line forming the triangle
CryptoBots
Profit Trailer Bot No closed trades
New Trading Bot Trading out using Crypto Prophecy. No closed trades
Currency Trades
Outsourced MAM account No closed trades. New trades open short on USDJPY (slightly positive)
Cautions: This is not financial advice. You need to consider your own financial position and take your own advice before you follow any of my ideas
Images: I own the rights to use and edit the Buy Sell image. News headlines come from Google Search. All other images are created using my various trading and charting platforms. They are all my own work
Tickers: I monitor my portfolios using Yahoo Finance. The ticker symbols used are Yahoo Finance tickers
Charts: http://mymark.mx/TradingView - this is a free charting package. I have a Pro subscription to get access to real time forex prices
August 27, 2019

Gold should pull back again at some point before going higher. I was wondering why you went long Natural Gas, but I see you are playing the support and trend line break.
I have a long standing position of 75 shares. I rounded it up and will write covered calls. The bottoming shape of the chart was the trigger and the seasonality profile. A classic charting idea. The fundamentals of gas supply are a big worry - it will turn as the pressure on coal power grows to push electricity supply across to gas.
Volatility seems to also have found a higher base given the uncertainty in these markets. Must be strange for investors that have only been around for 5-10 years!
Posted using Partiko iOS
Long silver
I am long silver - see TIB437 for the set up trade in iShares Silver Trust (SLV) and the first of the options trades.
See also TIB438, TIB442 and TIB449 for the follow up trades.
Hi, @carrinm!
You just got a 0.43% upvote from SteemPlus!
To get higher upvotes, earn more SteemPlus Points (SPP). On your Steemit wallet, check your SPP balance and click on "How to earn SPP?" to find out all the ways to earn.
If you're not using SteemPlus yet, please check our last posts in here to see the many ways in which SteemPlus can improve your Steem experience on Steemit and Busy.