
Welcome to the daily financial report about the Hive blockchain.
All the information presented in this report is based on the data collected from the blockchain until 2022-04-20 midnight UTC. This report aims to provide you with a clear view of what is happening on the Hive blockchain.
 Este post está traducido al español - aquí
 Dieser Beitrag ist ins Deutsche übersetzt - hier
 Une version en français de ce post est disponible - ici
1. Price
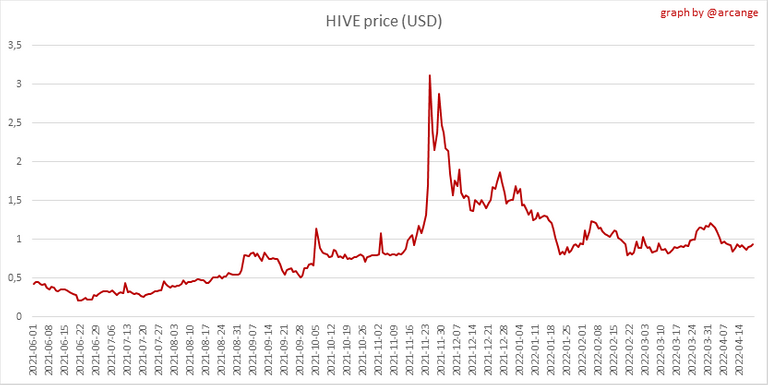 | 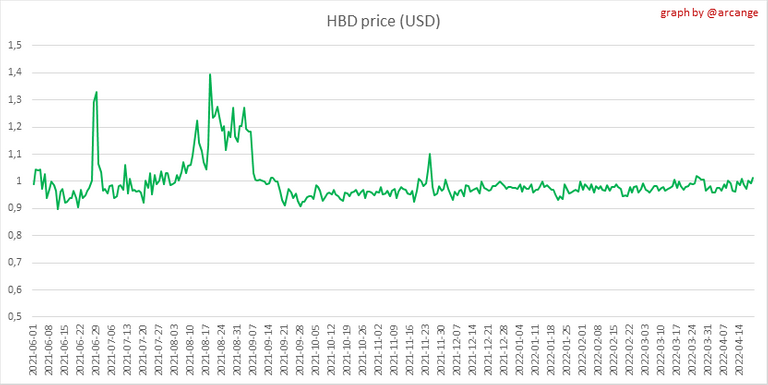 |
These graphs show the evolution of prices in USD for HIVE and HBD.
2. Supply
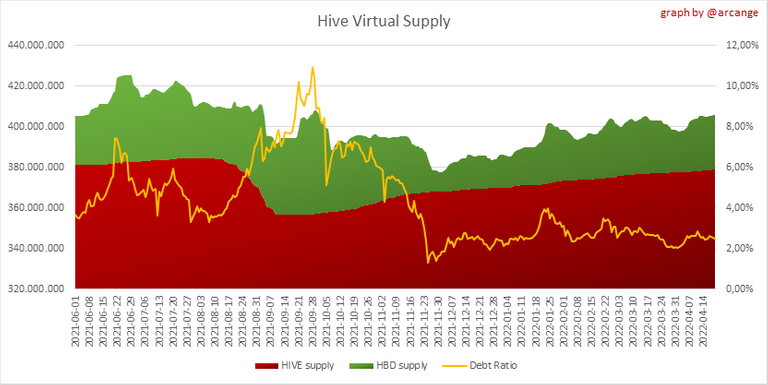
This graph shows the evolution of HIVE virtual Supply. The virtual supply is the sum of HIVE supply (liquid and staked HIVE) and HBD supply (converted into HIVE).
The graph also displays the debt ratio (HBD supply / HIVE virtual supply). Keep in mind that since hardfork 24 funds in the treasury (@hive.fund HBD balance) don't count towards the HBD debt ratio.
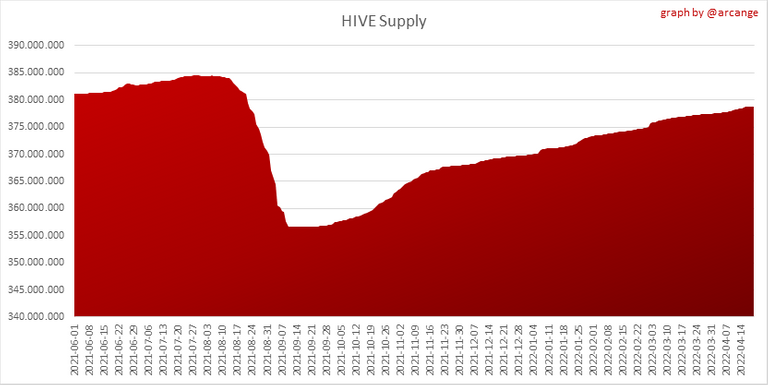 | 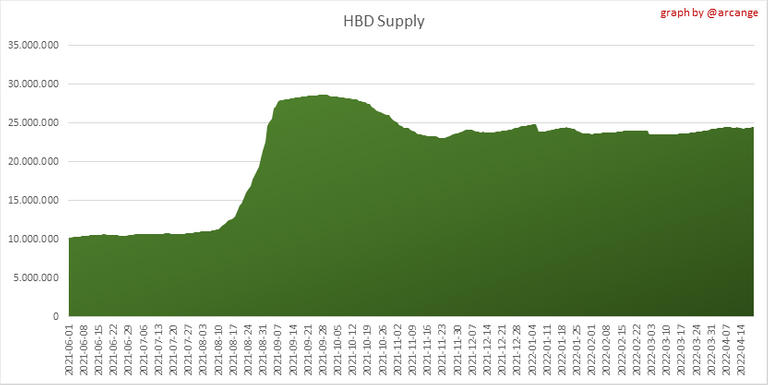 |
These graphs show the evolution of the HIVE Supply (both liquid and staked) and the HBD supply.
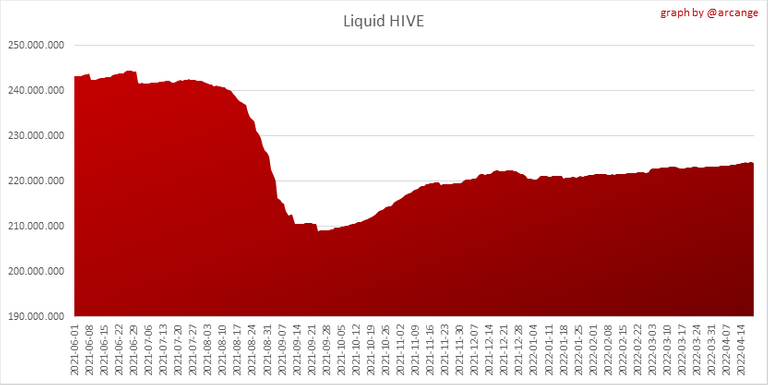 | 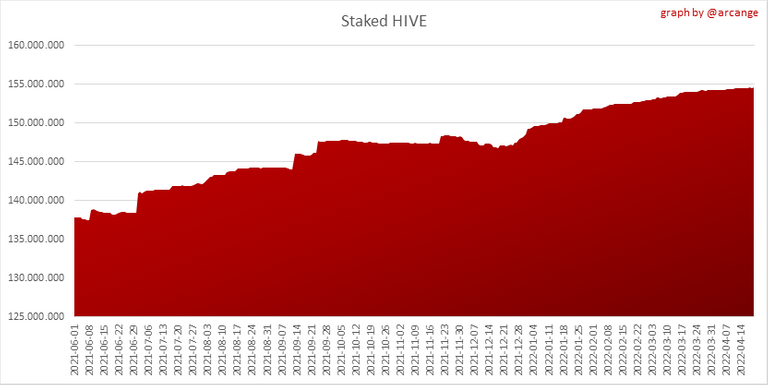 |
These charts show the evolution of the liquid HIVE and the staked HIVE (Hive Power).

This graph shows the overall Hive tokens distribution.
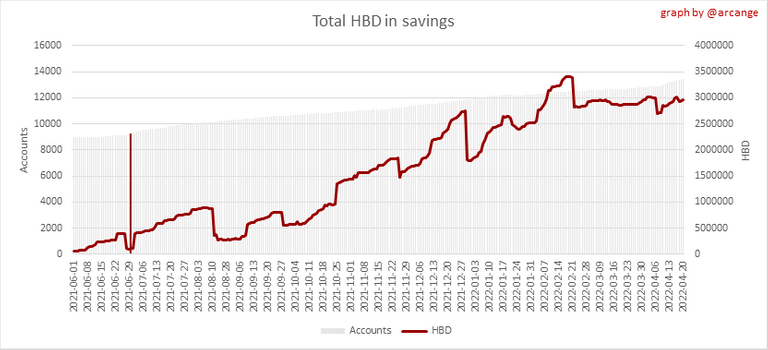
3. HBD Savings
| Account | Deposit | Account | Withdrawal |
|---|---|---|---|
| @konvik-cold | 5,000.000 HBD | @steemaction | 5,295.307 HBD |
| @coinmint | 2,336.680 HBD | @zaku | 2,000.000 HBD |
| @dedicatedguy | 1,576.508 HBD | @ganjafarmer | 224.846 HBD |
| @holoz0r | 1,405.186 HBD | @jk6276 | 104.674 HBD |
| @beststart | 1,372.624 HBD | @beco132 | 102.308 HBD |
| @xg4028 | 1,269.688 HBD | @inertia | 100.000 HBD |
| @foreveraverage | 1,215.322 HBD | @xsasj | 84.639 HBD |
| @anneadam | 1,021.354 HBD | @gynfreaks | 77.077 HBD |
| @romanie | 538.843 HBD | @felander | 76.887 HBD |
| @rezoanulvibes | 446.515 HBD | @acesontop | 53.145 HBD |
This graph shows how much and how many accounts store HBD in savings. The table below shows the topmost HBD deposits and withdrawals of the day.
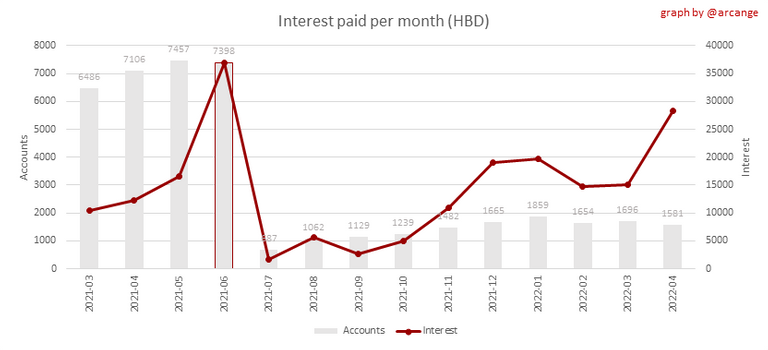
Note: As of 2021-06-30 (HF25) interest is only paid for HBD which are stored in savings.
This chart shows the amount of interest paid each month for holding HBD and how many accounts received such interest.
4. Balances
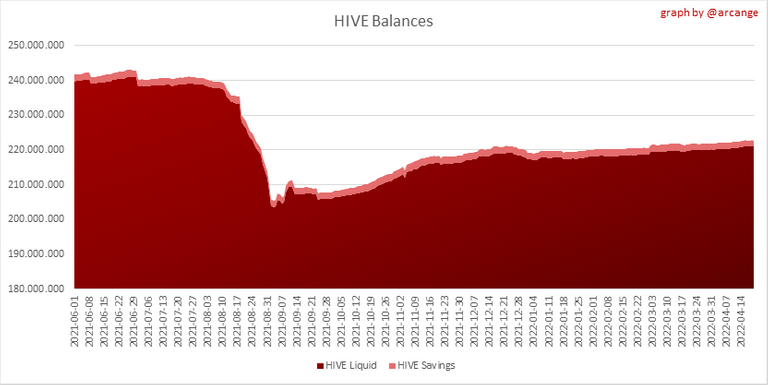
This graph shows the number of HIVE, both liquid and in savings, held by all accounts.
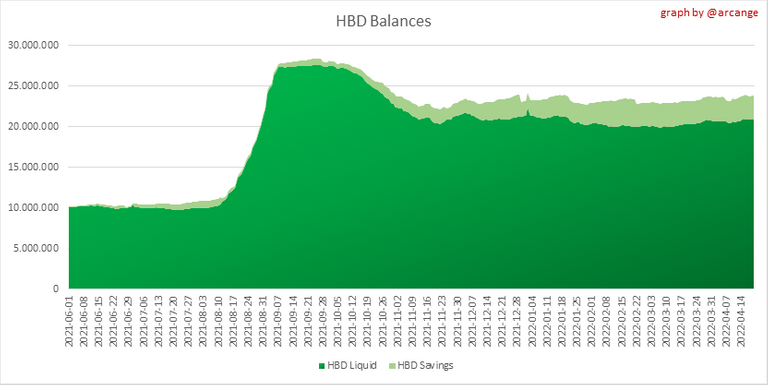
This graph shows the number of HBD, both liquid and in savings, held by all accounts.
5. Conversions
Note: As a reminder, conversion requests are only finalized after 3 days. It is only then that it is known exactly how many HIVE were burned in return for the HBD received at the time of the conversion request.
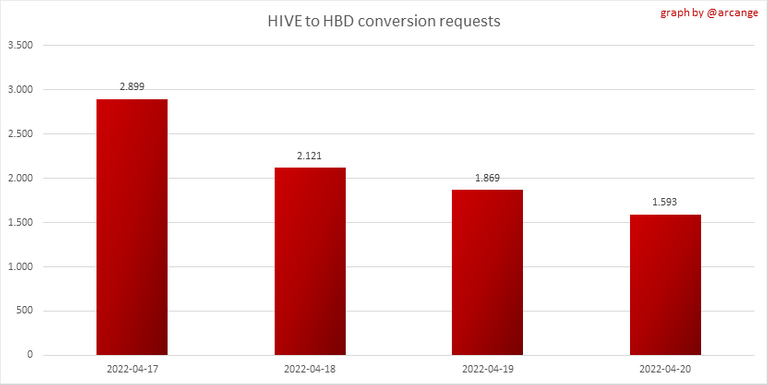
This graph shows the number of HIVE collateralized due to requests to convert HIVE to HBD over the past few days.
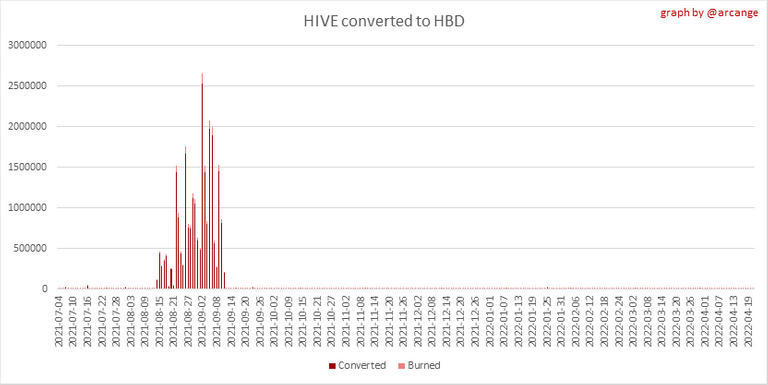 | 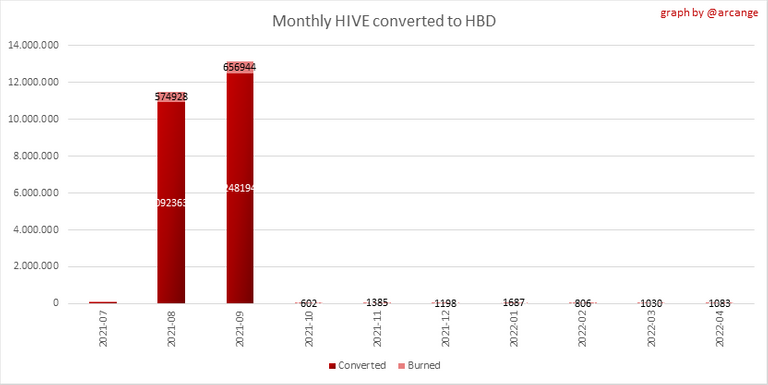 |
These graphs show the number of HIVE effectively used by the conversion process (HIVE converted and 5% HIVE fee which is burned) each day and month when requests to convert HIVE to HBD have been finalized.
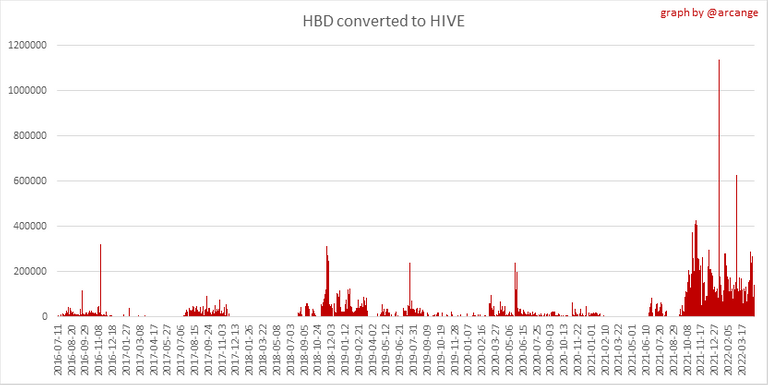 | 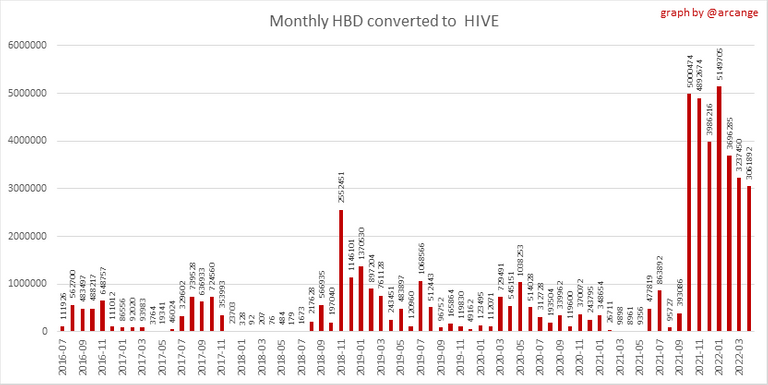 |
These graphs show the number of HBD burned, each day and each month, following requests to convert HBD to HIVE.
6. Powerup and Powerdown
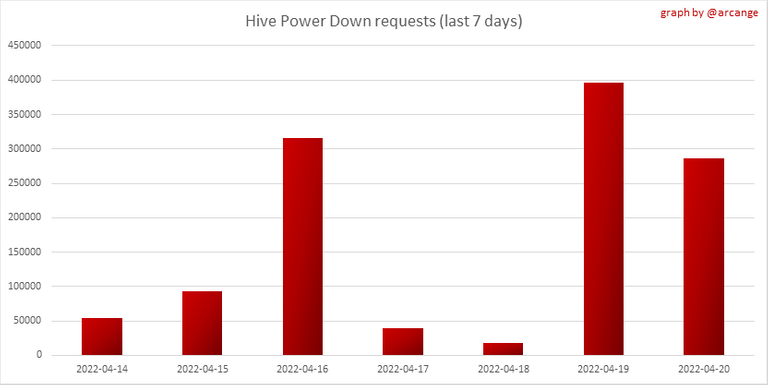
| Date | Account | Amount |
|---|---|---|
| 2022-04-20 08:46:21 | @buildawhale | 128,170.102 HIVE |
| 2022-04-20 02:08:09 | @steemik | 79,478.044 HIVE |
| 2022-04-20 10:44:45 | @omonomo | 41,001.379 HIVE |
| 2022-04-20 04:23:00 | @artmom | 6,222.593 HIVE |
| 2022-04-20 05:46:39 | @kgakakillerg | 5,384.326 HIVE |
| 2022-04-20 05:13:21 | @ambiguity | 2,452.126 HIVE |
| 2022-04-20 02:25:15 | @xels | 1,950.118 HIVE |
| 2022-04-20 06:20:15 | @mango-juice | 1,771.085 HIVE |
| 2022-04-20 08:34:51 | @enmaart | 1,598.127 HIVE |
| 2022-04-20 07:35:51 | @thisisawesome | 1,300.057 HIVE |
This graph and table show the amount of powerdown initiated over the last 7 days, and the largest initiated on this day.
| Account | Powerup | Account | Powerdown |
|---|---|---|---|
| @omonomo | 24,539.964 HIVE | @nathansenn | 5,913.512 HIVE |
| @skenderbeu | 7,051.472 HIVE | @ocd-witness | 3,319.525 HIVE |
| @jphamer1 | 2,095.965 HIVE | @acidyo | 1,797.874 HIVE |
| @genepoolcardlord | 441.900 HIVE | @mawit07 | 1,546.016 HIVE |
| @barmus81 | 251.749 HIVE | @kiemis | 1,379.288 HIVE |
| @crypt05 | 200.010 HIVE | @spk.beneficiary | 1,329.446 HIVE |
| @khazbot | 181.451 HIVE | @cooltivar | 1,182.288 HIVE |
| @homesteadlt | 134.647 HIVE | @reward.app | 1,011.196 HIVE |
| @vtvclrrf | 125.000 HIVE | @catwomanteresa | 879.069 HIVE |
| @z3ll | 100.000 HIVE | @amirl | 859.990 HIVE |
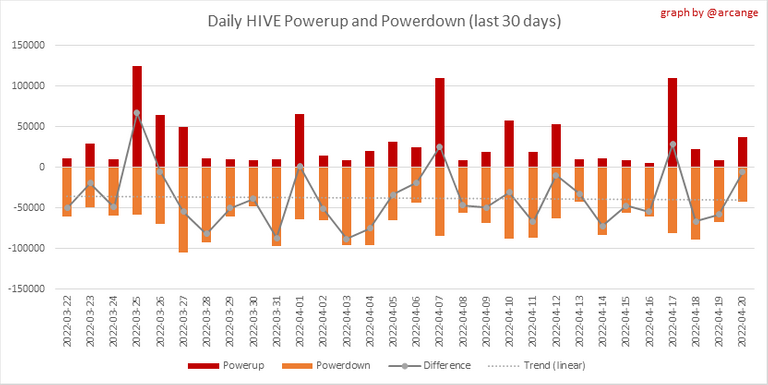
This graph shows the daily HIVE power-up, power-down, and the resulting variation over the last 30 days. The table shows the topmost power-ups and power-downs of the day.
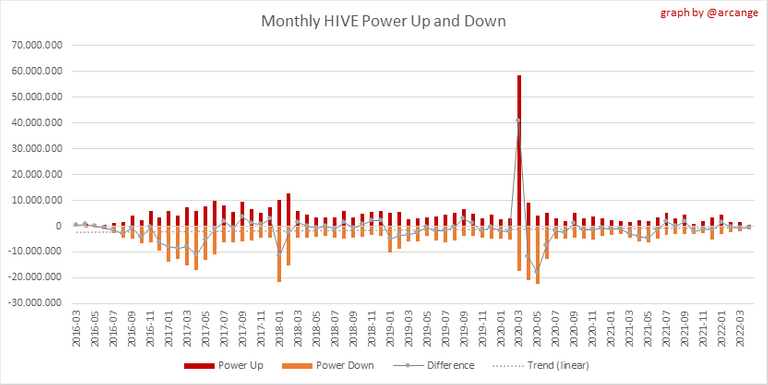
This graph shows the monthly HIVE power-up, power-down and the resulting variation.
Values for the last 3 months
| Period | Powerup | Powerdown | Difference |
|---|---|---|---|
| 2022-04 | 647,466.000 | 1,401,557.000 | -754,091.000 |
| 2022-03 | 1,495,982.000 | 2,097,310.000 | -601,328.000 |
| 2022-02 | 1,749,531.000 | 2,228,644.000 | -479,113.000 |
7. Transfers
These graphs show the volume (in USD) of HIVE and HBD transferred between accounts.
8. Exchanges
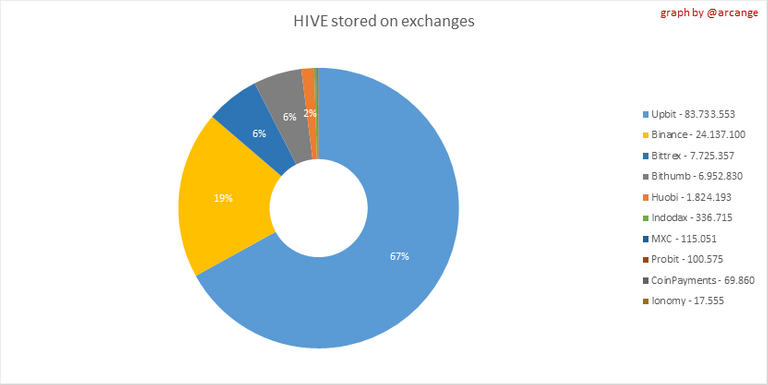 | 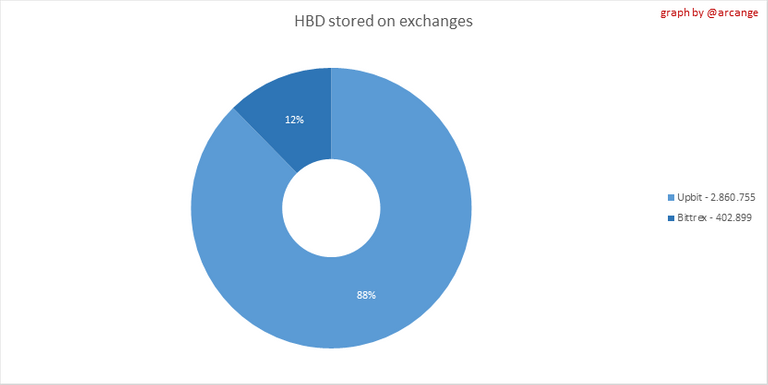 |
These graphs show the amount and distribution of HIVE and HBD stored on the exchanges where they are listed.
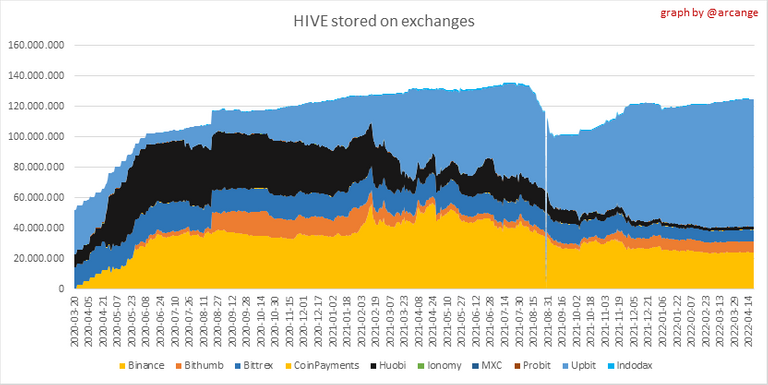 | 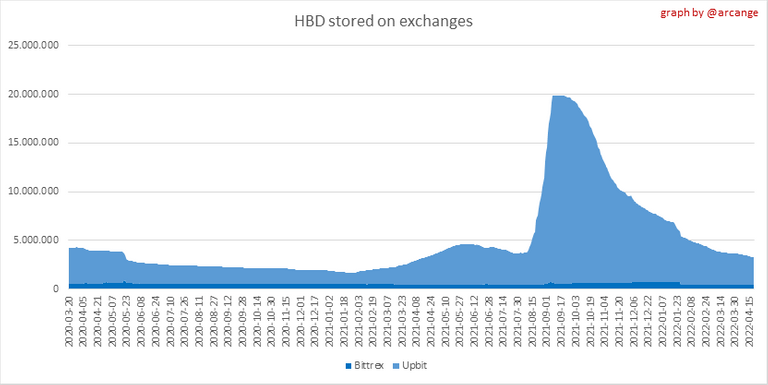 |
These graphs show the daily evolution of HIVE and HBD stored on the exchanges where they are listed.
I hope you find those stats useful. If you would like to see additional stats, feel free to drop me a comment. Your feedback is than welcome.
Thanks for reading.
Check out my apps and services


Phenomenal information yet again thank you very much.
224.846 HBD
So much sir.. 😍😍
Work hard and create content you might end up with such savings...
Thank you @ganjafarmer
You're very welcome thank you for all the hard work that you guys do on the blockchain