What was difficult to explain before is now easy to visualize.
source
Visualization and communication of the data is an important step in researches.
We have cameras in order to capture the world outside of our bodies.
But we can’t just go inside a cell and take pictures of all we want.
Visualization
the act of making something visible to the eye
source
Scientific visualization
is an interdisciplinary branch of science concerned with the visualization of scientific phenomena
source
is the process of representing raw data output as images that can aid in understanding the meaning of the computer experiment results.
source
Biologists can communicate their findings visually with the help of
-> Images, videos, models for 2D or 3D data (simulations)
-> Data figures (for abstract data)
-> Model figures
-> Animations
In this series I’d like mostly to talk about molecular visualizations (visualizations of the world of molecules).
I’m not a professional scientist and don’t have much experience with art. It’s just the beginning of my journey in the world of visualization. And I’d like to share it with some people who might be interested in it.
In a nutshell, visualizations help us to generate/test new ideas/hypotheses and communicate our findings to reviewers and to the public [1].
The act of creating a quick, rough sketch can be a creative and exploratory process, allowing us to refine a hypothesis and develop new lines of questioning.
When you are creating an animation you are really grappling with a lot of issues that don't necessarily come up by any other means [source [2]].
Scientific visualizations also have a critical role in engaging and inspiring the public [source [1]].
When you read something like
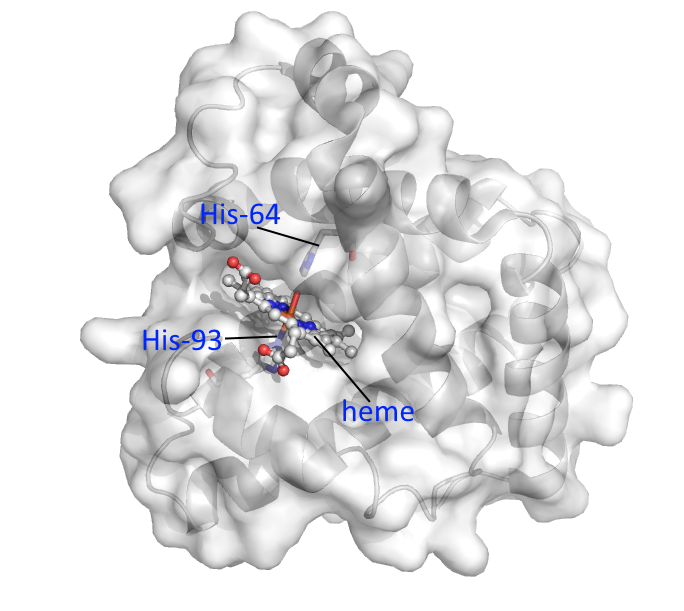
Myoglobin contains a porphyrin ring with an iron at its center. A proximal histidine group (His-93) is attached directly to iron, and a distal histidine group (His-64) hovers near the opposite face.[19] The distal imidazole is not bonded to the iron but is available to interact with the substrate O2
source
, it’s not always easy to imagine all that.
Illustrations allow to encode all that text information into images, animations and simulations.

(Myoglobin. It's the protein carrying oxygen in the muscle tissue of vertebrate. The image was created by me with the help of PyMol - open source tool for molecular visualization/exploration. You can use the image if you want. PDB-file was obtained from PDB. You can see heme at the center of the molecule)
Myoglobin is the first protein with its three-dimensional structure/atomic structure revealed in 1958 [11].
Just like the science of protein structure began with myoglobin, this protein symbolizes the beginning of this series.
Art + biology is a powerful combination
The video below was created by Harvard University in collaboration with XVIVO in 2006.
It took 14 months to create it [4]. The video is considered as
the pivotal moment for molecular animations
source [3]
In order to understand the text, you need to know the meaning of the words, so that you could represent all the information on your "mental stage" (with "actors") [5].
Illustrations show you the meaning of those words directly. Animations might help us to see/understand how something functions, even if we don’t know what it is.
Also our working memory has some limitations (the number of “actors” you can hold on your inner stage is limited)[6].
That’s why it’s hard to imagine, let’s say, a protein (or a metabolic pathway) with all its details/elements.
And illustrations help to overcome them.
Just like fairy tales for children are usually accompanied with illustrations, biologists try to accompany their findings with them as well. This helps them to create and tell the stories to the public. To tell the story, you need some characters. And modern tools help us to create them.
And the cool thing about the stories is that
Stories are up 22 times more memorable than facts alone.
Jennifer Aaker
Jennifer Aaker
is an American social psychologist, author, and General Atlantic Professor of Marketing at the Stanford Graduate School of Business
source
They say that light serves as a symbol of life [8].
Just like that, the following images symbolize the beginning of "life” of this series of posts.

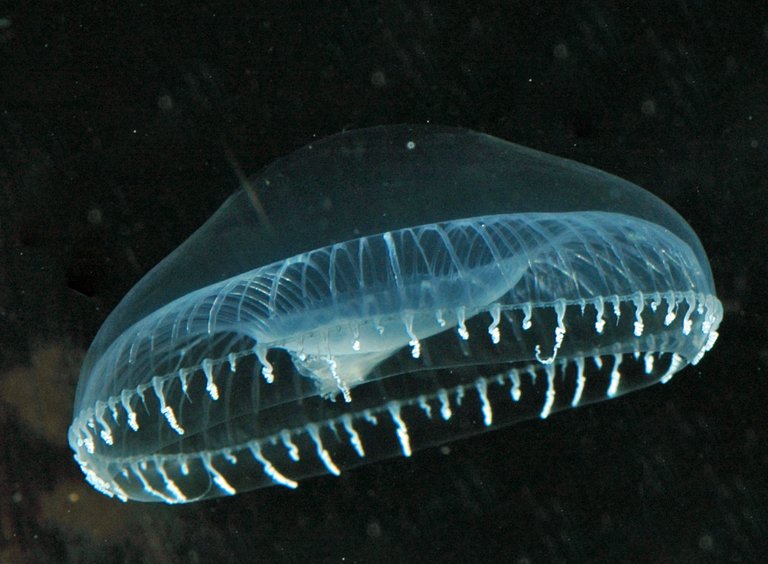
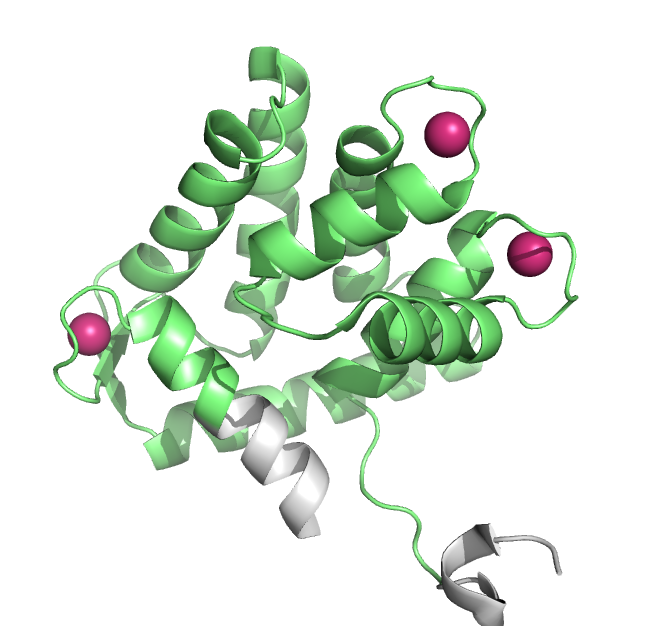
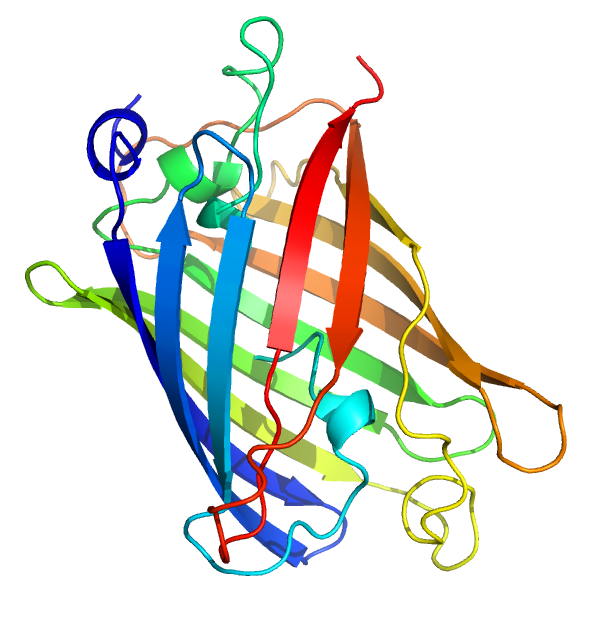
Bioluminescence capabilities of Aequorea victoria in the form of blue and green light are due to aequorin and green fluorescent protein (GFP) correspondingly. Ca2+ released by the organism interacts with aequorin, resulting in blue light, which is then transformed into green light with the help of GFP [10].


What could not be imagined can now be simulated, and what would only be seen with sophisticated equipment is now accessible for everyone to see
source
I believe it's one of those cases, when it's fair to say that pictures/animations are worth a thousand words.
All images (without the license specified)/videos are used under the doctrine known in USA as "Fair Use" (similar doctrines are used in other countries). For more information visit the US Gov website.
References
David Rock. Your Brain at Work: Strategies for Overcoming Distraction, Regaining Focus, and Working Smarter All Day Long. October 6, 2009
Jennifer Aaker Stories are 22 times more memorable than facts alone